What’s inside?
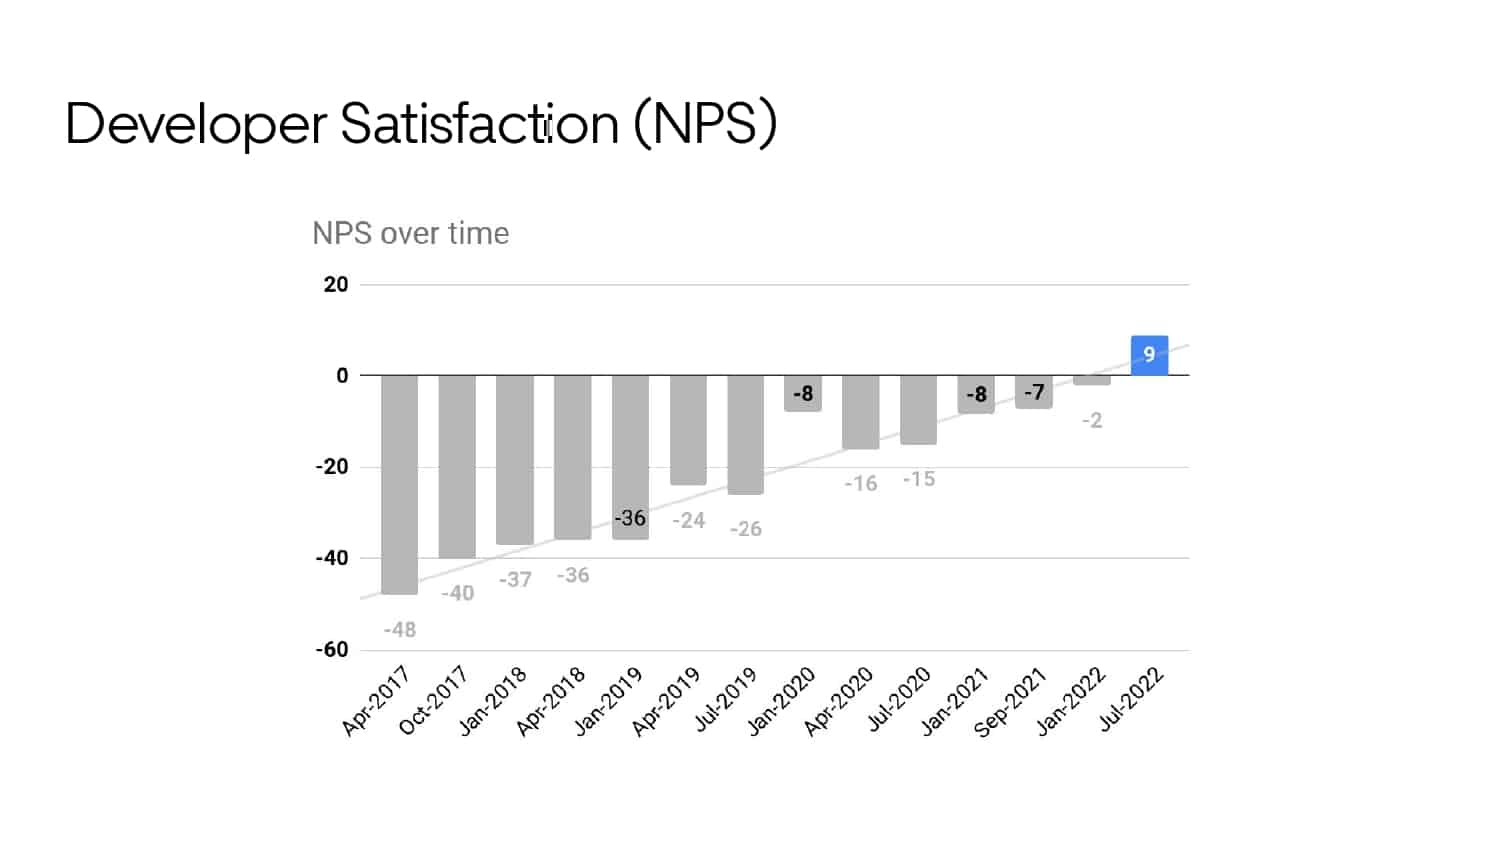
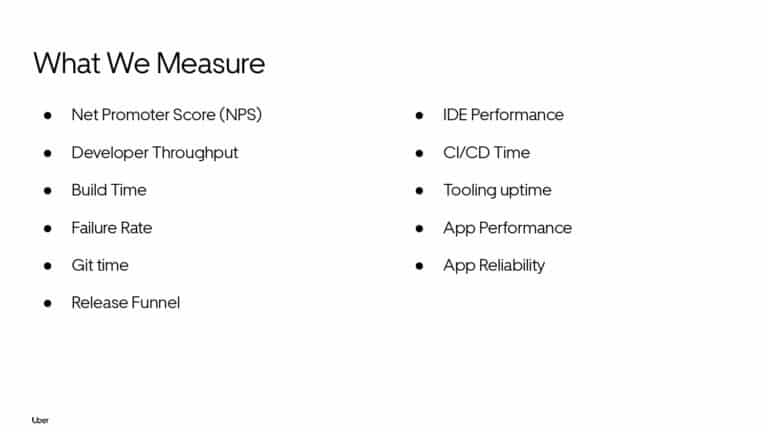
Ty Smith will share the key metrics that productivity engineers at Uber capture and utilize to optimize Developer Experience. He shares one of their biggest DPE initiative’s wins that you will not want to miss learning more about.
Summit Producer’s Highlight
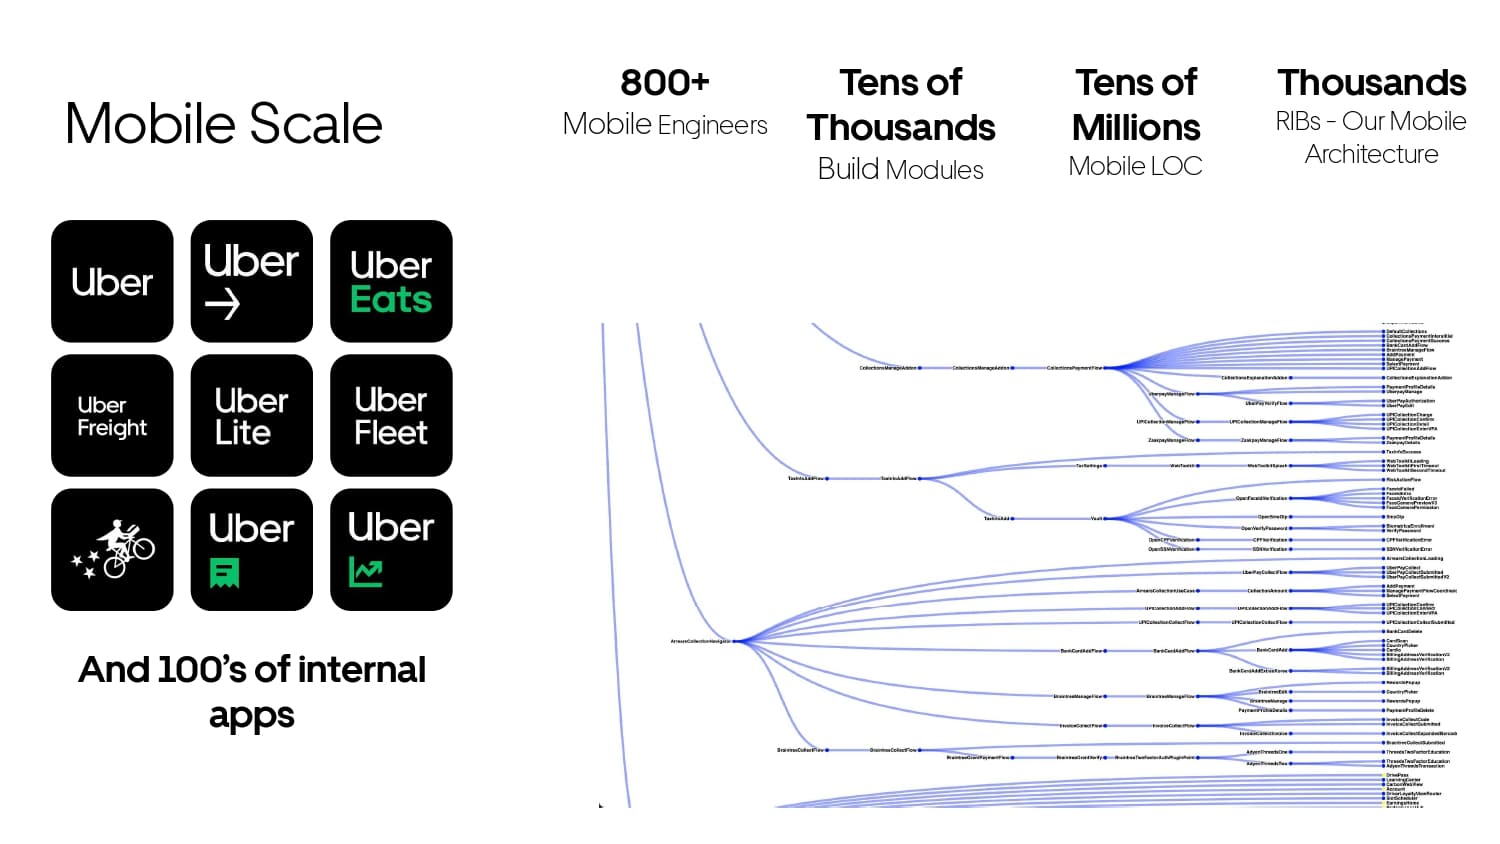
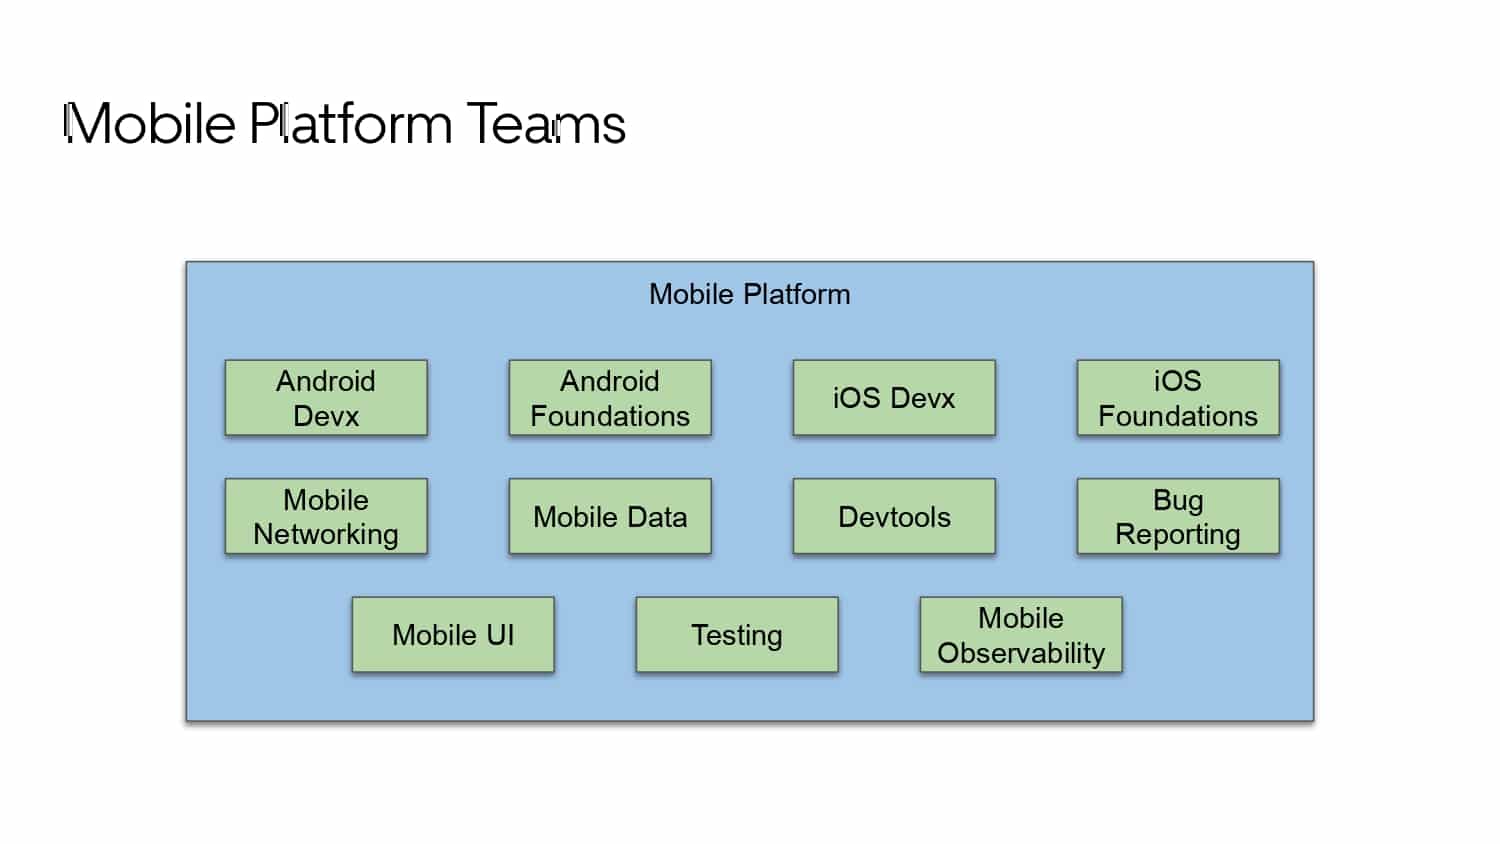
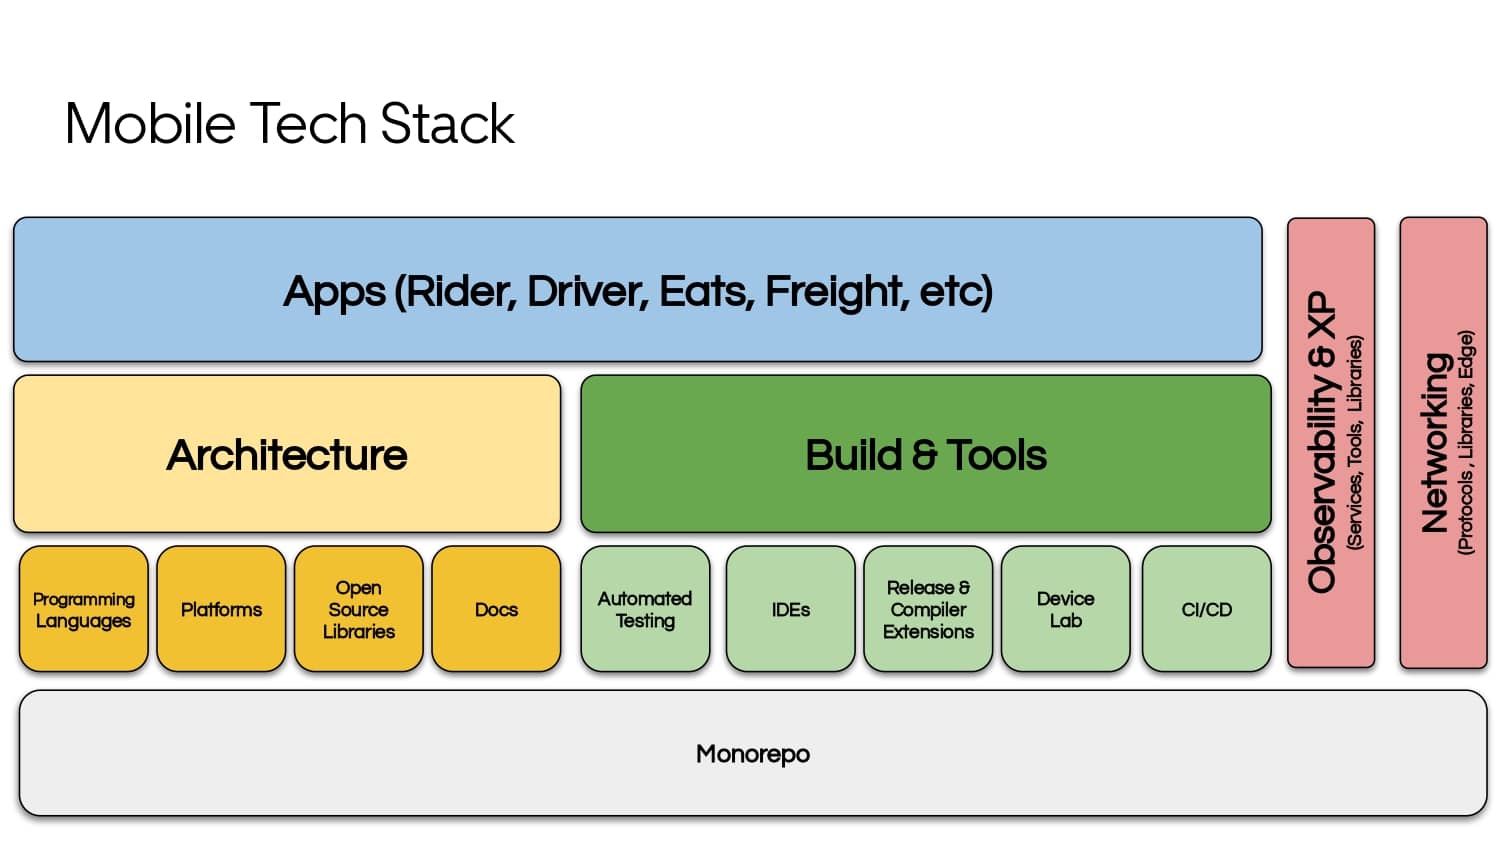
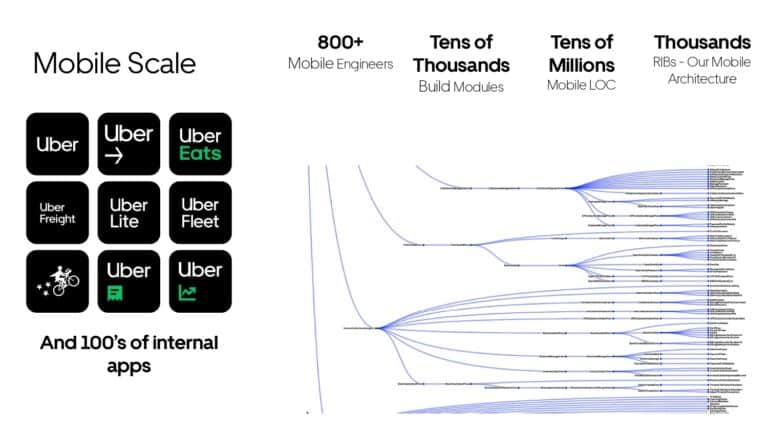
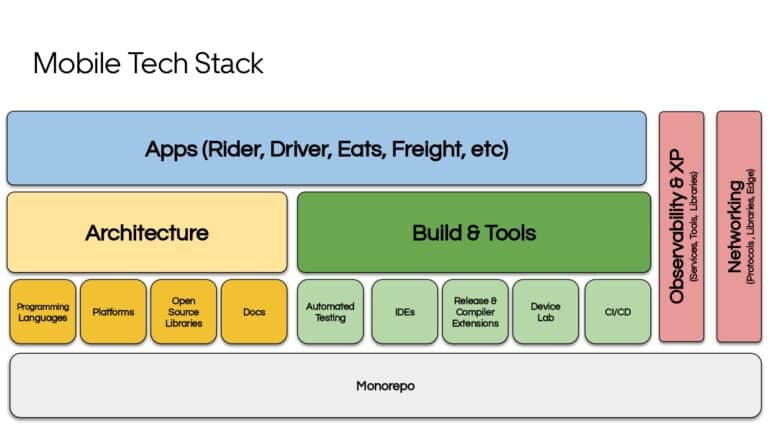
Building large mobile apps is hard. Keeping developers productive while working on large mobile apps is harder. Most Android developer tools target smaller apps, so what’s the best way to think about building some of the largest apps in the world? In this talk, you’ll learn how Uber enables hundreds of Android developers to contribute to hundreds of apps in a single monorepo while keeping developers productive and shipping reliable apps quickly.
About Ty
Ty Smith is a senior staff engineer at Uber, where he leads the Android platform group and chairs the Uber’s Open-Source Technical Steering Committee. He is passionate about tools, frameworks, and open-source to help developers make great mobile apps. Ty is a Google Developer Expert for Android and Kotlin, engaging regularly with the community through conferences, open-source, and writing, and as an organizer for conferences and meetups. He is an angel investor, tech advisor, and a member of multiple venture capital advisory syndicates. Ty has been at Uber for six years. Before that, he worked at Twitter on the Fabric developer tools, Evernote, and a variety of smaller startups and consulting firms.
More information related to this topic
Gradle Enterprise Solutions for Android Developer Productivity


Performance Acceleration technologies for Android eliminate the pain of idle wait time and avoidable context switching resulting from long build and test feedback cycle times. Gradle Build Scans for Android give you granular analytic information for every build. Failure Analytics can leverage build data to proactively find unreliable builds and tests and learn how many people and environments are affected by the problem. Finally, Flaky Test Management will help you proactively detect flakiness in your application and tests.
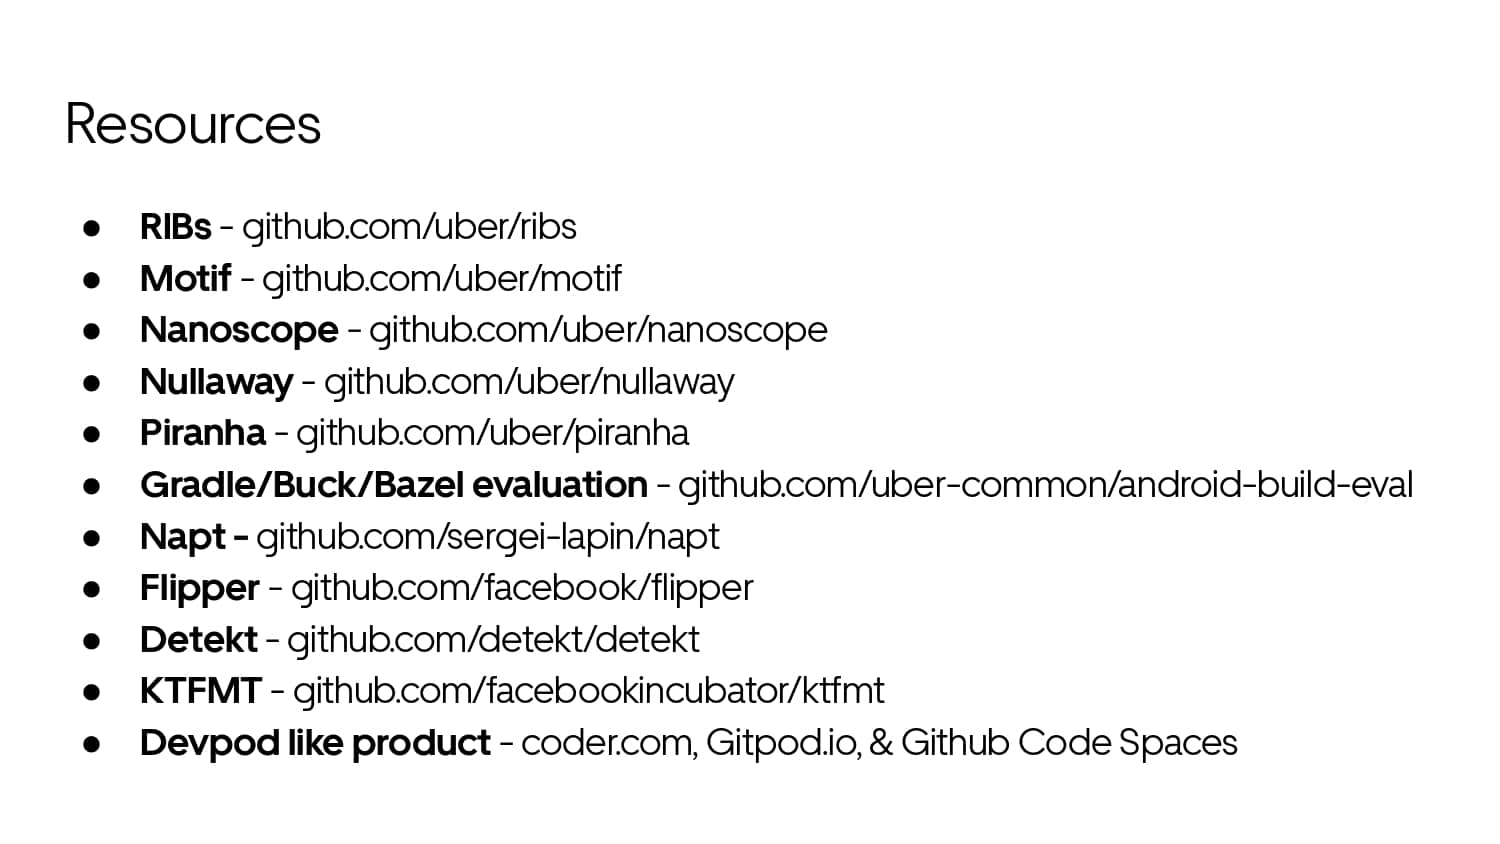
Interested in Android Developer Productivity? Try these next steps:

Ty Smith: All right. Let's give Rooz a hand. He's a great hype man, huh? All right, everyone. I don't think I need to intro myself after that, but I'm Ty, I work at Ube, I lead our Android platform team. I've been doing Android a very long time now and working for developers for most of that time at this point. So today we're going to be talking about mobile developer productivity at Uber. I've given some similar talks in the past, most of the time they were focused on kind of the in-app development and the libraries and frameworks. Today we're going to be talking a bit more around the developer experience, some of the build tools, IDE, how we measure that sort of thing. So real quick, the agenda, I'll give a brief overview of kind of the scale we're working with within Mobile, specifically at Uber. You attended my colleague Gotham's talk earlier. He kind of gave an overview of mobile in general, of Uber in general, we'll be zooming in to the mobile space a little bit. Then we'll talk through the development stack in the workflow, how we measure things, how we make our builds faster, and what are some of the constraints that we have. And finally, we'll dig into the IDE and some of our dev tools.

So I've been at Uber about seven years. I've seen this grow quite a bit, right now, Uber probably has around 800 mobile engineers. I say probably, because we have a lot of polyglot engineers that contribute and all of the different repos, and so typically we measure this by monthly active contributors to our repos. We have tens of thousands of build modules, tens of millions of lines of code in Android, and then our mobile architecture called RIBs, which is viper-like architecture. It's all of our apps use this, everything that's built it's converged, and so we have thousands of our architectural units and code base as well. And then obviously many, many production apps and hundreds of internal apps as well. So let's talk a little bit about how we structured the teams to support this kind of scale. So at Uber, there's typically three types of teams or maybe two and a half. You have your feature engineers, which are on cross-functional teams and they're just working on the end product. They maybe working on a specific feature in the rider app or the eats up, and then we have within those orgs, we have some platform teams that typically kind of serve a product platform role. So they may own some of the core flows or core features as well as some of the architectural and library needs for those applications. Like there's a rider platform team, a driver platform team, and then we have the core infrastructure platform engineers and pure library engineers. This is where I live in the organization, and these are folks whose customer, at the end of the day is entirely other developers, either internally or with our open-source projects external as well. There we go. So to slice that a little bit different, here's a very simplified view of our org chart reporting up to our execs. We have multiple big orgs. I said under platform engineering, which has all of infrastructure, you know, compute storage and everything else, as well as developer platform, which is an org of about 200 people that focuses entirely on building our DevEx, and frameworks, and code review and everything else. Under that, a sub-org called Mobile Platform is what I lead. This is probably about 30 engineers total and Android and iOS, and then we have a number of kind of dotted lines into that. And then the mobility org you know, has Rider and Driver, they have their platform team, which I described as well as a ton of feature teams working on those end features, and then a delivery org, and then there's a bunch of other one-off orgs, like Safety and Freight that kind of have similar views, but this is just kind of to give you an overview of this. And then we have a cross-cutting built for our more senior mobile engineers called mobile IRC. We use the branding as kind of a cross-functional guild in general, and then there's specific domains like mobile, web, email that sort of thing. So if we're to zoom in a little bit more on my org, which is serving the developers and what we're going to be talking about a little more today, mobile platform has a number of sub-teams. We have DevEx teams, we have foundations which is frameworks teams, we have networking teams, we have observability, data, dev tools, testing, all kinds of stuff that kind of sits under this group.

And our vision is to be the industry leader for how developers build, deploy and manage high-quality software productively and at scale. This is for our entire org, and when we take a look at the mobile engineers specifically, we really take this to heart as our north star at the company. The end of the day, this little cartoon justifies well what we're trying to build. We want other companies to look and say, well how did Uber do that? We're going to take some inspiration from that.

So let's talk a bit more around the tech stack and the developer workflow that all of the engineers working at the company are using to build, that our org is putting out. Well, we are in an Android mono repo or an iOS mono repo. I'll talk about Android specifically since that's my bread and butter. We have a number of the apps that live within that, and they sit on top of a core set of architecture and framework and build tools. And then, under that we support, Kotlin as a programing language. We have many open source libraries, we have documentation platform we own. We have storage library, and UI libraries and all kinds of stuff like that. And then, we have build tools, and testing, and IDE our team, and device lab, and a bunch of stuff. And then some cross-functional groups that focus on things like observability or networking. And here, if I zoom in a little bit more, here's a big list of things that I'm not going to go through. All of them you can kind of reference back when I post the slides, but this starts to kind of line item. A few of the things in each one of those areas, from our architecture Ribs, to some of our open source libraries to code gen our views like stylist and artist, to our remote development environment or our developer analytics stack. They kind of live in some of these others, and I'll, I'll post this and at the end, there's resources with a bunch of links where these are open source, so you can dive into more of these. This is mostly to give you the perspective that we do push the standardized environment that folks are using, and so when they are these, you know, feature engineers that are working in it, they have a very standard stack that they can use.

So the mobile, the workflow looks a little bit different if you're a mobile developer at a big company than if you're a backend developer. You know, if you're a backend engineer, you might be able to deploy quickly, and if there's an issue, you can fix it, you can redeploy, you can hotfix. For mobile engineering there's some different constraints, right? You're putting out a binary into the wild. It has a long period of time going through App Store review and verification. You have in customers that may be on versions that are much older than the current one and they may not update regularly. And so we have this long cycle of verification, you know, first moving from the developers and our loop where they're developing to CI and our submit queue, you know, our CD pipeline finally into like dog fooding and verification with testing, at any one point in this as it's moving further to the right, if there's an issue that feedback is more expensive, right? And so, it's we want to try to prioritize moving these things left, but this is kind of an overview of this, and as we talk about measuring our analytics and our DevEX, I'll call back to this a little bit. So let's hop into how we think about measuring this. We you know, we're an org serving 500ish, 400 - 500 Android engineers. We have our org goals, KPIs, everything else. Obviously, we need to get leadership buy in, we need to have things we can measure, how do we think about that? Well, we have a lot of different things that we measure. You've heard in some of the earlier talks people discussing NPS or Net Promoter Score, that's definitely a really important one to us. We do regular developer surveys and take a bunch of feedback and ask the NPS question. But then we measure overall developer throughput and aggregate build time, a lot more granular things like failure rate, git performance time, the overall release funnel time that I was showing a minute ago, you know, the time there, the delays there, that's all measured. The IDE performance. We have a lot of metrics in the IDE like indexing or code analysis time, file opening time, a bunch of stuff like, CI/CD up time and then, you know, the apps things themselves, reliability, performance, you know, we measure those.

So NPS, I won't go too deep into this. You've heard a lot about it today, but it asks the question, would you recommend this developer stack to someone else? And we've been tracking this for a long time. We've seen this consistently going up into the right, as we continue to invest and developers are more productive and happier. And then in that survey, we also ask a bunch of free-form questions and with those comes with a lot of great feedback that we're able to take into our roadmaps and planning. So the other big part of our analysis stack, though, is this tool we called LDA or local developer analytics. And so this is a daemon that we've run on everyone's development developer environment, it's on their local computers. And it has hooks into all the different tools that they're using. It collects this data, and then it forwards this up to a log collection front end, which pumps that onto Kafka. And we can, you know, set that up for monitoring, we could search it, we can query it, we can use it for debugging. It becomes really powerful for us understanding the data so that we can move from just taking anecdotal or customer feedback into quantifiable things that we can measure. So what are some of those local hooks that I mentioned? Well, you know, we hook in to git, so we can get git performance time. We hook into arcanis, which is the CLI for fabricator, which is our code review tool like GitHub. We're moving off of that to Github, but that's still around for folks today. You know, we have wrappers into Buck or Bazel or Gradle, depending on what folks are using so that we can get out the build data and pump that up. And then we have customized IDE plugins that are forwarding all of the, you know, IntelliJ or VS code data up as well. And then, you know, the standard like custom CLIs throughout the company. Typically those are emitting logs to LDA as well.

So what does that kind of look like in practice? Well, here's one of the debugging dashboards we have for IDE. We're measuring indexing time and code analysis and a bunch of the stuff that you probably heard about if you went to the JetBrains talk earlier to hear about why mono repos and IntelliJ don't really play nicely together. You know, we're working closely with them and we're trying to improve a lot of this stuff. But, you know, it takes measurement and data to get to the point where we understand what those problems actually are. Having dashboards like this, being able to setup alerting or understand what's going on has been really, really powerful for us. So let's move on to the next category that I want to talk about. We've talked about measuring. Great. You know, we know how what works we're going to prioritize. We know what we're actually going to fix. Let's address the primary issue that people always talk about in the NPS score, which is builds being slow. A brief history of the build systems for mobile at Uber. Back in 2016, we moved off of Gradle to Buck. We were using an open-source project that we maintain called OKBuck that is a Gradle plugin that generates dynamic Buck build files. We were much smaller at this time, but it's still a pretty large app. Over 2016 to 2019, we migrated fully off of dynamically generating the Buck files to a pure Buck implementation where we're really only using Gradle for dependency management at this point, and then we're using Buck for a much more paralyzed and hermetic build. Last year we started evaluating a move to Bazel to align with the rest of the industry, and we've been deep into that migration ever since. Right now we're in a shadow system where Bazel is running in shadow to Buck, and we're starting to take beta users with a plan to fully migrate over and deprecate Buck next year. Now, if you're not a mobile developer, you may not necessarily understand the pain points that come with build times that mobile folks have that's pretty unique. So here's an interesting analysis that I did a little while back that helped educate some of our leadership that wasn't necessarily mobile engineers to understand this pain point. So if you're building a mobile app, you're building a giant monolith typically, right? There's tons and tons of modules. Those are all assembling one binary. So if you're building backend and you're in a typical microservice architecture, then you're probably just building a handful of targets when you're trying to compile something. So we used LDA and we created the data and we saw that the P75 number of build targets built per invocation by the developer when they're coding is, you know, close to 200 on a rider app and it gets up to 100 on driver and eats. That means every time they're making any change and they're hitting build, it's having to recompile that many number of targets, versus our backend services where that was 2. So obviously it's much worse on mobile. But let's view this in a slightly different way. This is the dependency graph visualized for our rider app, and as you can see it's very clear what the architecture looks like from this picture right? Well, maybe let's zoom in a little bit, maybe make it a little clear, a little further. So as you can see, it's a giant spaghetti mess of dependencies. Right. And this is some of the problems you get into with really large mobile apps where you're assembling these monoliths. And this is even with like a very clearly defined architecture and dependency direction you end up with hell like this. So if we were to start to break apart the compilation problem, if you were to just understand basic dependencies, right? Like this is a visualization and part of that graph. We have a couple of modules that depend on eachother in a transitive chain.

Well, let's talk about how this slows us down and how we can make it faster. In this case, if I built BazModule or if I made a change to BazModule and I built Foo, it's going to need to rebuild everything up the chain without any optimizations. Now, for 12,000 modules, that means you're going to be rebuilding a lot of stuff. But the tangent for a minute, to explain it, to say why this is even worse for us, is in the Android world, people have moved off of Java to Kotlin, and we did a study a few years ago that we've released on our blog that demonstrated Kotlin is two times worse on most workflows than Java with error prone and about four times worse than Java without error prone. Now this gets worse in some common cases, like if you're doing annotation processing or if you're mixing Java or Kotlin, which we both do a ton of. So not only are rebuilding 12,000 modules, but we have a ton of Kotlin Code and Kotlin's much slower than Java, so now our mobile engineers are really suffering. So I'll give a couple high level concepts for build that we need to use to talk about the optimizations. We'll first cover build inputs and outputs, cache keys and then ABI jars. So in a hermetic build environment, you have a build target and it takes a number of inputs. Those, you know, the configuration, the dependencies, the toolchain information and then the output of that is a, you know, it's an artifact, it's an archive, a JAR, an AAR and APK, whatever. So and then that entire thing is cached up. And out of that, you get a hash, that's the cache key. This is how the build system references that specific module, and when you make a change, you know, it can query the build cache and say, hey, is this hash changed? Do I need to rebuild this or can I use the thing on disk? Similar basic concept for Bazel, Buck, Gradle, whatever. So ABI Jars are where this gets interesting. So if we have foo depending on bar here and we make a change to bar. Does foo get rebuilt? Well, it depends. So without ABI Jars, if yof had bar module that just had this basic method bar that had a content of foo, when you build that, you would get a class file that looks similar. So if I made a change from the content of that method from foo to foo bar. It's going to rehash the class file and that's going to be a different hash. So if I make a change to bar, foo going to say, hey, that's different, I need a rebuild foo as well. ABI jars are where you can try to address this some. So an ABI jar, is a jar or it's a class file that has all the inner contents of the methods stripped out or private methods or anything that's not exposed out to the consumers. So in the same case, I have the bar method and the class file that's generated is missing the implementation detail of this public method. So when I hash that, it's hashing the full contents and if I change the content of foo to foo bar, the class file doesn't change. So hashing that again, it's the same as the previous value. So this means I can make these changes in the bar module and I don't necessarily have to recompile foo. So this is one of the techniques we can think about for optimizing that build. So we talked about the high-level ABI. Now we'll dig into, class ABI jars versus source ABI jars. So a class ABI jar is the more naive technique that some of the build systems use to generate this. You take your source module, you pass that into JavaC or KotlinC. You get out your class files in your jar, you then apply that to an ASM processor and it strips out the inside of those methods and it gives you a second artifact that is the ABI jar. Now, this gives you the advantage of getting your output and you don't have to rebuild this stuff like we talked about. But obviously this is more expensive because you're having to run full JavaC and then you're still having to run a second step. So this is where source ABIs give you an optimization. A source ABI jar is the concept of generating it at the source compilation level, not as a post-processing stuff. So, you know, at a high level we throw the module over to JavaC or KotlinC, and without introducing a second step, it's able to output both the ABI and the regular class file. To dive into that a little bit more. What JavaC does is it has four stages in the compiler. It has a parse+enter section that's a little cheaper where it's parsing the code and then an analysis and a generation stage. And so what Buck does, which is interesting, is it is you're able to output the ABI jar because you have enough information at the parse+enter stage and that can unlock downstream dependencies and then you can finish your compilation and get the full jar. So what does that look like?

Well if you, use this thing called Rule pipelineing that enables you to have these build targets that have multiple steps. And because of that, you can emit the ABI early out of the parse+enter. It unlocks foo module. Now foo module can start compiling before bar module is done. And so your overall build, assuming you have a huge number of dependencies, is going to be faster. Now this gets a little more complicated than Kotlin, because Kotlin can also produce a source ABI, maybe from a compiler plugin that's maintained by JetBrains. Unfortunately, by the time KotlinC enough information to output the ABI jar, it's really negligible. If it's going to do any more work and output the full jar. So they output both at the same time. So you don't get the same optimization that you see in JavaC. And this is where this gets complicated for mixing Java and Kotlin sources, because if you're mixing these, you have this pipeline internally to the build system. Typically, first, you take your mixed sources, you take the Kotlin files, you hand those to KotlinC. You also hand the java files to KotlinC. It uses the Kotlin files for compilation and it uses the Java files to analyze and reference types. And out of that, you get your class files just for the Kotlin files. And then it hands all of those class files and the Java sources to a second step in JavaC, where it uses the Kotlin class files, as you know, on the class path, and then it compiles the JavaC and then it gets the output of that, and then it bundles all those up into a jar. So now the problem is, if you were to use mixed sources, you can't use source ABI and rule pipelining by default. So it's more expensive to build the same number of Java and Kotlin targets. Sorry, Java and Kotlin sources as one target as opposed to two dedicated targets that's one purely Kotlin and one purely Java with a dependency. And so we thought we could make this faster. And we introduced this hybrid mode of rule pipelining, which helped a lot here. So Kotlin behaves the same. We take the source files, we output the class files, but we also output the ABI class files at the same time. And then we hand all that to JavaC, and JavaC uses the previous behavior that we talked about with source ABIs where it's parsing+enter exits early because JavaC is able to output the Java ABI class files and then we compress all of the ABI class files into one jar and then we continue with the Java compilation for the remainder and then output a full jar. Now, this may not look like it saves you much, but in a large system with tons of dependencies, we've now met parity between having dedicated Java targets versus mixing Java and Kotlin targets because with this this chrome tracing style graph that we have here, we can see that while you still have to do all the KotlinC work, we can get the same exit early from the JavaC of this. And so this is what enabled us to turn on mixed source sets for all of the Uber rep, and we've been banning it until that point, actually. So we talked a bit about ABI jars and mixed source sets. Let's talk about the next optimization, which is per class compiler avoidance, not just the ABI jar, compiler avoidance. So to give an overview of this, let's say you have a module and it has 2 dependencies, but it's only using references from one of them. Well, if you make a change to the one that's unused based on the traditional dependency setup of Buck or Bazel, it's going to require you to rebuild the parent anyway. So Buck introduces this thing called use classes.json. So it uses a compiler plugin in KotlinC and JavaC, and it has a wrapper on the file manager. So anything that's loaded, it's tracking. And then it outputs an artifact that keeps a list of all the things that were used. And it applies that as a filtering mechanism within the dependencies in the build system. So if I have the same example where I make a change in something that's unused, it's not going to be in use classes, therefore I'm not going to need to rebuild it as a dependency, even though the build system thinks it's the dependency. And what does that look like in practice?

Well, it's actually pretty trivial. The Kotlin, the Java one is in the Buck repo the Kotlin one is now on the dev branch of the Buck repo as well. We have a PR that's out for Bazel as well. I can give you the link for that in a minute. But the implementation of this is it's just a Kotlin compiler plugin that extends the analysis handler extension. It has a call checker and a declaration checker. So it's just getting visited for every one of those type references. It's writing that to a map. And then at the end of the step, it writes that all out to the format that the build system expects, either JDeps or Bazel, which is used in like strict mode warning or the the upcoming compiler class avoidance PR or for Buck and used-classes.json. So we talked about the per class compiler avoidance. Now let's talk about annotation, processing improvements. Sorry, this one should have been before the previous slide. Anyway, this is the results of the compiler avoidance data. So this is where that win comes in that we were just talking about. So if you look at Bazel out of the box, this is an example from our internal repo on a Kotlin target. It's building a huge number of targets compared to Buck, and so Buck is doing these classes and all the other stuff that we talked about. Bazel doesn't have that built in. So we put this PR up. This has a per class compiler avoidance technique that's used in Bazel core. With that, we're able to pretty much get parity between Buck and Bazel for compiler avoidance, which can be significant because this number of targets that we're seeing, it's about the same number of seconds it takes to build these as well. So lastly, let's talk about annotation processing and the part of the build that's slow there. So we make internal we make heavy use of annotation processors in our android mono repo. Last I counted, we have 17 different ones internally. An overview of the space in the JVM world, we have KAPT for Kotlin, which is fully supports Java annotation processing, but it's quite slow as we showed in our study. We have traditional Java annotation processing, which is much faster. However, it doesn't support Kotlin at all. And then we have the new Kotlin symbol processing, which is an abstraction on the compiler plugins, which is fast as well, but it isn't backwards compatible with annotation processors and it takes work for me to author to support that. So there's not great support in the community quite yet. So what is KAPT doing? Why is it slow? Well, if you have your module, you have your source file and it's annotated. You want to do some code gen on that? It's going to run capped as a compiler in KotlinC. That's going to do three steps the stubs, the annotation processing and the compilation. Now you have multiple invocations to KotlinC potentially. Out of that, you get an implementation file where you have code gen something with KotlinPoet or whatever code gen you're wanting to do. Out of that, it builds both the class file for your source and the class file for your generated code, and then you set that up into a jar. But this is about one and a half times as slow as annotation processing on Java or Kotlin without annotation processing. So we thought, how could we? Use Java annotation processing where it's much faster to resolve some of our needs in the Kotlin world? And so we were able to figure that out.

There is a couple opensource implementations of this as well that I can link at the end of this. But what we end up doing is we think, hey, if we have the annotated classes already, can we get JavaC to just process those and skip doing annotation processing all together in Kotlin? And so we were able to do that, I'll show you how after I get the animation to play. So what we're doing is we built this Java compiler plugin called Kaptish. The open-source one for Gradle is called Napt. I think the one for Bazel has a different name, but they're all three open-source at this point. What this does is if you have a class retained annotation on your source file, it'll be preserved through the initial compilation, and so we don't run annotation processing on that at all in KotlinC. So we get a class file and it still retains that annotation. We hand that down to Java and it uses this compiler plugin that says, I'm going to take the list of those class files around the class path and I'm going to force Java C to run annotation processing on those, even though they're not source files, and it's able to do that because JavaC itself actually exposes this as a command line argument. It's not really known. It doesn't have a lot of usage in like standard tool chains, but you're able to tell it to process class files and run annotation processors on those. So this is a very simple implementation of what this is doing. We have a Java compiler plugin. It takes the list of class files. It forces them into a specific argument that JavaC's expecting and at this point it will run the annotation processor on these. Of course, this has some downsides. If you are generating your, if you have your sources in KotlinC, and then they hands those class files off to JavaC, then you can't reference any directly generated code. You could have two treated as two different modules, essentially. So many annotation processors like auto value, you have to reference it directly. So that's not compatible. We we don't use that very much. That is an anti pattern. So we're able to work around that. Some folks use reflection for that first entry point instead. You must also have class retained annotations. This isn't a big deal in Kotlin where there are class retained by default, but in Java their source retained by default. Those would get dropped before those class files are output. And lastly, it can't actually generate Kotlin code, right? Because you're doing the work in JavaC, which means that the compilation has to be Java. So even if you're processing Kotlin files, the generated code needs to be Java. So, you know, using Java Poet as opposed to Kotlin Poet. Okay. So we talked about all the ways we've made builds faster so that it's reasonable to work on a 12,000 module Android application, going forward, we have some things that we're looking at as well. We're really excited about KSP. We'll be working closely with that team to probably shadow in Q1 and start giving feedback. Sorry, K-2 compiler for feedback. We are also excited about KSP. We've already ported many of our internal annotation processors to KSP and we'll continue doing that. Our DI library motif that's open source, which was just recently moved to support KSP. And lastly, we're going to be looking at flattening our build graph more than is done right now. One of the big problems with a mobile monolith is the depth of that. So we'll be thinking about how to make that wider and get more optimizations out of the build system natively. So with that, let's move on to the last section of the talk, which is around IDEs and dev tools.

So first quick overview. If folks are doing android development at Uber their basic local development look something like this. They have a new M1 Macs laptop. They're using IntelliJ 2022. They have a bunch of standard Uber IntelliJ plugins that we provide. We fully provision like the IDE settings, like the VM options and code style. We have the analytics team and that's running on their machine and we manage various standard applications on that with Chef, and but there's still some downsides to this. They have to set up their own Android SDK. They have to upgrade the SDK. They do a security update in Mac that might conflict with some of the toolchain stuff that we have. And so there's there's issues and manual developer overhead that we're not super happy with. So to talk a little bit more around the local experience in the IDE itself. We have a bunch of plugins. We have the analytics plugin which I talked about, which hooks into LDA. We also have a bunch of stuff to scaffold, new modules, new ribs, our architecture component that supports compose, a scaffold new sandbox app, which is just like a demo app where they can do features specifically in that, not have to build the whole thing. We have an explorer for our DI graph. We have an explorer for our architecture graph. We can recommend and enforce third party plugins as well. And then a bunch of things like live templates and real-time UI updates. So a lot of functionality that we put into the IDE directly. An interesting one here we can dive a bit more into is the real time UI updates. So we built this tool called Quick UI for Android, and this is kind of our cheap version of live edit. So what we discovered is a lot of developers are building just UI iteration, right? They're adjusting in XML file. This is XML only so no compose quite yet. But they're adjusting that XML file. They're tweaking, they're adding new margin or new colors or whatever. And when they do that, it has to do the full build. And we talked about how expensive that build is. So in this case, you know, we see that if they're just building that, we thought, well, how can we just make that XML change without having to rebuild the entire thing? And so what we have is we built this tool and it deploys the application with a custom wrapper on the layout inflator. And so that knows how to read both the standard layouts that are deployed in the application as well as from a second APK that we can put on disk. Kind of like how espresso uses a second APK, and then in our build system, we detect if it was only XML files that were changed. And if it was, then we just do a compilation directly on the CLI of those XML file, and we push that over with like an ADB command. So those sit on the SD card and then the layout inflator receives an intent and it sees that something is updated and it will rerender that screen. And so this is much faster. It takes a couple of seconds to iterate on UI as opposed to a minute or so to do a build. So I have a demo of this.

Now, let's see if the video works well. Okay. It's a little small, but I wonder if the people in the back can full screen this. Okay, maybe not. What we're doing here is we're editing XML attributes, so we're changing some text, and we ran the build command, and with that it restarted immediately so that took about a second, and the text is different, and on this next one we're editing the margin so you can see we changed the margin in the XML, we run the build command, the application restarts pretty instantly and it's back on the screen and the margin has been adjusted. So keep in mind that a build of the full app averages 60 to 70 seconds. And with this iteration, we're seeing it reflected in about a second. So the other really interesting part of the IDEs for us is how we're thinking about remote development and cloud IDEs. So we've had local development for years. We see the industry moving towards cloud IDEs, big servers. We've seen, we've passed the limits where a big mono repo can work on our local laptop. So how do we use a big server to make development faster? You probably use things like remote build execution on Bazel, but now we're starting to see the migration of IDEs there as well. With these giant graphs, the IDE is very resource constrained. Even running that locally and punting your builds off to be remote executed it isn't enough for us. We're seeing large performance issues. So by putting the IDE on the server, we're able to reclaim a lot of that. So what are we doing here? Well, we have this beefy Linux dev server and we're provisioning these where all of our developers are. So, you know, we have folks in the U.S., on the East Coast, on the West Coast, in India, in Europe. So we have all of our cloud regions with these devs that are distributed, and it's a containerized dev environment. So we manage the entire thing. We know the version of the JDK, the version of the Android Toolchain, we're able to install all our custom tools. We're able to preload the cache for everything, right? For the IDE, we can preload the indices so we can just plop those directly down on disk for the build cache. We can put that there for the artifact cache. And so the developer, they're just spinning up these machines that are instantly ready to go and have the full environment. And we're running the IDE as a daemon with everything preindexed, so they can, you know, just immediately start up a new dev environment and have everything ready. You know, we allow these to be user customized. And so they're running JetBrains Gateway, which is their new remote development environment that connects to the IntelliJ backend. What's really cool, and what we keep hearing from developers is these multiple of these at once. So if you're on your computer, we know that context switching is really expensive. If you're on a big mono repo, it may have to, you know, builds and project something new that may take 10 or 20 minutes to context switch, which, well, people will just set up 2 or 3 dev servers and they'll have 1 for, you know, 1 branch, 1 for another app, and they have the IDEs instantly ready to go, so they'll just hop between these as the dev flow changes. So there's a couple of interesting parts from the mobile side specifically that I want to talk about. One is how we work with emulators or devices. So if you're thinking, hey, Android Cloud IDEs, but I have my local device, that's not going to work. Well, we have some workarounds. We're thinking about maturing this more. But right now we do enable local emulators and devices to be connected to the dev server. So we have a custom wrapper that manages the SSH port forwarding with a socket and we'll have the developer run that in the local environment and that'll forward it along. And then on the remote dev server, it sees the emulator or the physical device like it's natively attached. So you can see it in the IDE, you can debug, you can install to it, and it works pretty well. Besides a little bit of network latency for transferring large APKs. So the other really cool part about this that we talked about was that snapshotting section. Right. So the snapshots, we have a cron that's running nightly and it's booting up one of these dev pods. It's setting up the entire thing. It's loading the IDE, it's doing the builds. And then it has a list of all of the specific outputs where it put temporary files and it archives all those up. So things like the IDE indices, the Buck cache, the Bazel cache, the Gradle cache. And then it uploads those to a data store. And then when the developer sets up a new machine or when they turn it on in the morning, we're able to load all of those archives and they'll instantly have this ready to go. Now to give a little example of what this does in practice. If you were to index our full mono repo, it takes about 38 minutes. If you were to use JetBrains shared index plugin, which uses the indexes that you upload, but it still has the relativize those and change paths and toolchain info and parse them all. It's about 30 minutes versus the approach we take where we're taking those indexes right off disk and plopping them on to another machine, because we control the entire environment, including paths, and they're all the same for every user. It takes a few seconds. So it's a drastic difference.

So I'll give a quick demo. And as long as they don't kick me off the stage for being a few minutes over, you guys can see what the dev pod experience looks like. So in this example, we have an emulator up and running and we have a terminal. I just ran a create command, so I'm creating a new dev pod. Now I'm running the dev pod PS command, which is going to list all of the running ones I have. You can see I have 6 or 7, so I'm using them for different flows. I have different branches on each one. Are different apps indexed on each one. Now I have a couple tabs open here. One is one of these dev pods that I have gone ahead and set to the project selection for the eats app. And another one is the project selection for the rides app. So here in the eats app, dev pod, we can SSH in and it's going to give me the output for how to connect the IDE. So I have a JetBrains gateway link, as well as a VS code link, or an Android studio link so you can click those and get started right away. I click Gateway here and this sets up the thin client on your local environment and that connects to the running IDE that is running on the server, and so this is instantly up and it's fully indexed in the app. This is very responsive. It's using the code with me protocol, which is an asynchronous protocol for the text editing, and then it's using the projector rendering, which is their synchronous rendering that sends swing calls over the wire for all the secondary panels. So I'm in a Kotlin file on the rider app, oh sorry, in the eats app. Now, let's switch over to the rider terminal for this dev pod. I'll SSH in here it's going to give me a similar thing where I see the link, I click it, it's going to set up a second thin client. So now I have two thin clients running. Both of them are referencing two different servers. Both of the servers are fully indexed for our monitor repo and two different apps. And I can make different changes in these. I can. I'll be compiling here in a minute. None of that is using my local machine resources and I'm able to context switch very quickly between the two of these. So let's install the app. Well, first we have to connect to the emulator because it's an Android app. So we have a command that wraps the port forwarding that the developers can run. So they just select the dev pod they want. They run that. And at this point you can see if it was a little bit bigger or if you can squint that the emulator is connected here in IntelliJ, you can see the logs on the bottom that are flowing past. You can attach the debugger, all of that different sort of stuff. So let's run a build command. We're going to build the eats app. We're going to install it over the wire to the emulator. So this is cached right now. So it's building from cache, which is going to be very fast. But then the majority of the latency is going to be transferring the APK over the wire. So I think in this demo it's 10 seconds or so, it's really going to depend on your network bandwidth, how that looks. So buildings are almost done, installing, building is done, sorry, installing is done now, it launches the eats up. So this was built on the remote server. It was transferred over the wire. We launched that. I'm now back in the IDE. I can see from a debugger perspective it sees the device I can attach, I can do breakpoints, I can switch over to the rides app now, for the other dev pod, and I can also attach an emulator to a second machine because you can port forward to multiple remote servers at once. Both of those can see the emulator as native devices, and so that can be really powerful for when you have one emulator and you're doing multiple flows. So I'm installing the rider app that's going to do the same thing, that's going to transfer over to the same emulator. I can also see that in the other IDE. So that's about the end of the demo. I'm going to skip the last couple of seconds. It's just we click back into the right, but this really gives you like a concrete example of where you can have two different flows to different large mono repo you're working with and the local computer is using like one core. You know, it didn't even have to use any of the resources. You can imagine a world where you set this up on like a Chromebook or something very fun. Let's see. There we go. So that was the end of most of the content.

For Recap, we gave an overview of what mobile at Uber looks like, what the dev stack and workflow looks like, talked about how we measure things, everything from developer sentiment to LDA and the everything from builds to IDE performance. How we think about making builds faster so that we can build large mobile applications using ABI avoidance, compiler avoidance, improving the annotation processing and then how we think about the IDE experience and getting folks to iterate quickly and have a good UI. Quick UI for deploying quickly and our remote dev stack. So. Here's a list of resources. You can take a photo or I'll post slides later. This is a lot of the stuff that we talked about earlier, our architecture, our DI, performance profilers that we build. That is the open source tool that I mentioned as an implementation of the annotation processing for Kotlin. If you all are interested in that and that is everything I had. So only 4 minutes over Rooz won't be mad.