

What’s inside?
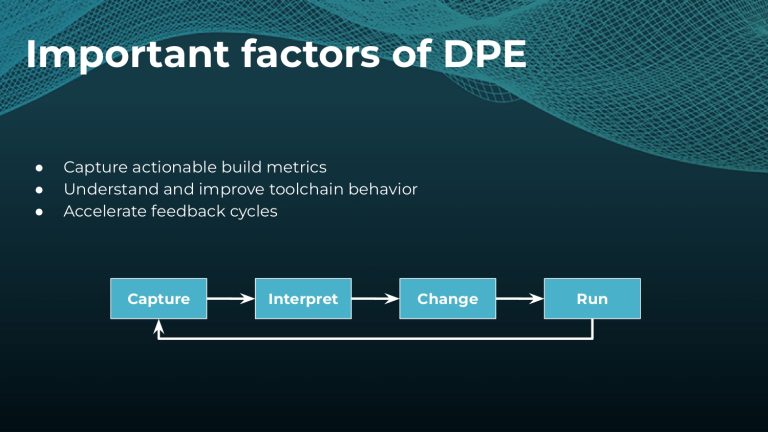
The practice of DPE prioritizes speeding up builds and tests. One of the techniques used to accomplish this is called build caching. In this talk by Gradle experts, we review strategies and tooling to make builds cacheable, which avoids re-running components of builds and tests whose inputs have not changed. We also discuss how to keep builds cacheable by catching regressions before they impact performance.
The practice of DPE prioritizes speeding up builds and tests. One of the techniques used to accomplish this is called build caching. In this talk by Gradle experts, we review strategies and tooling to make builds cacheable, which avoids re-running components of builds and tests whose inputs have not changed. We also discuss how to keep builds cacheable by catching regressions before they impact performance.
Summit Producer’s Highlight
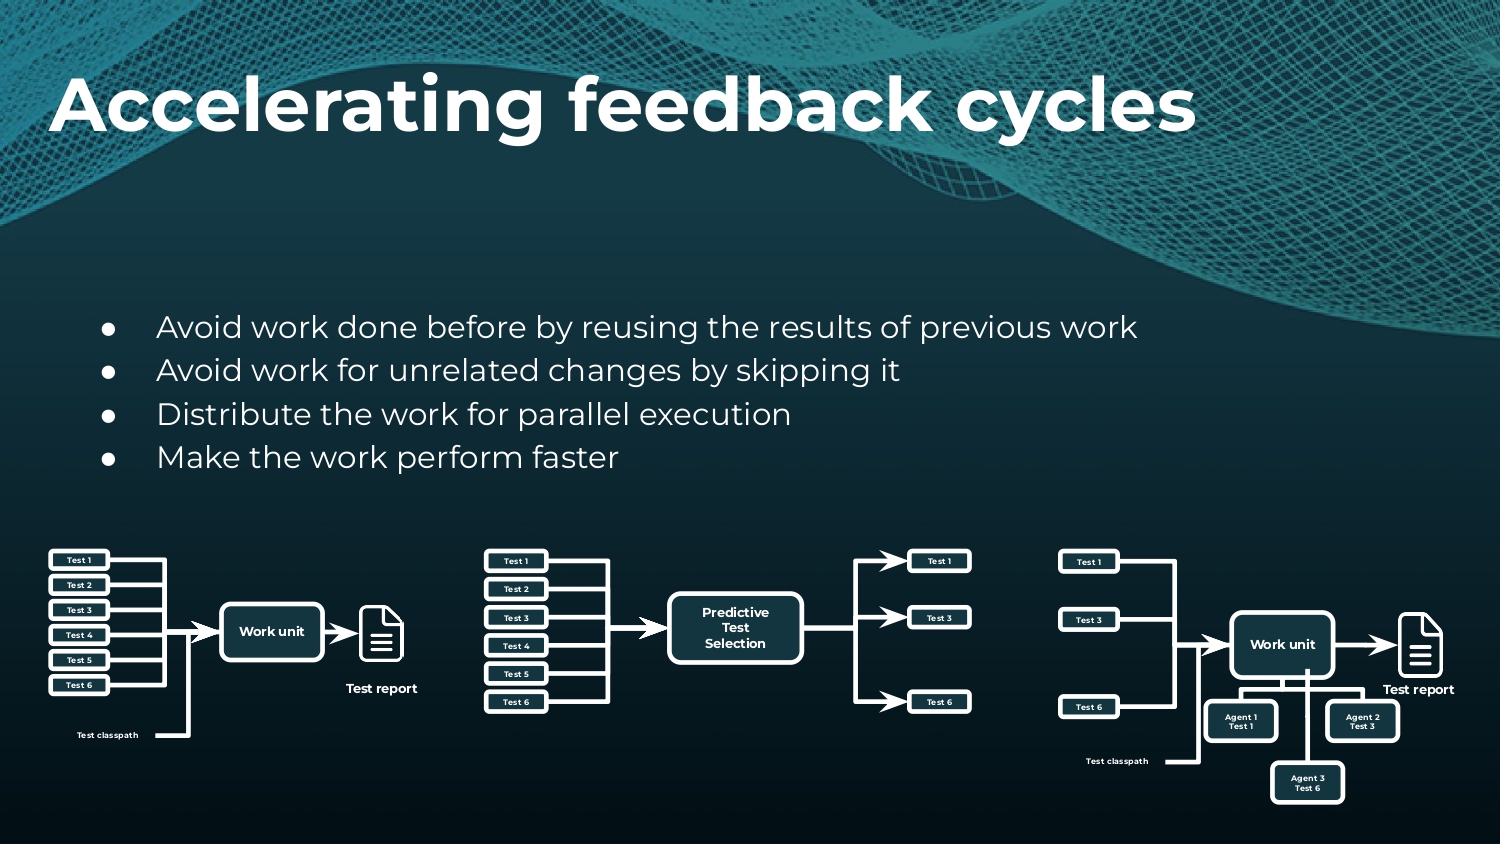
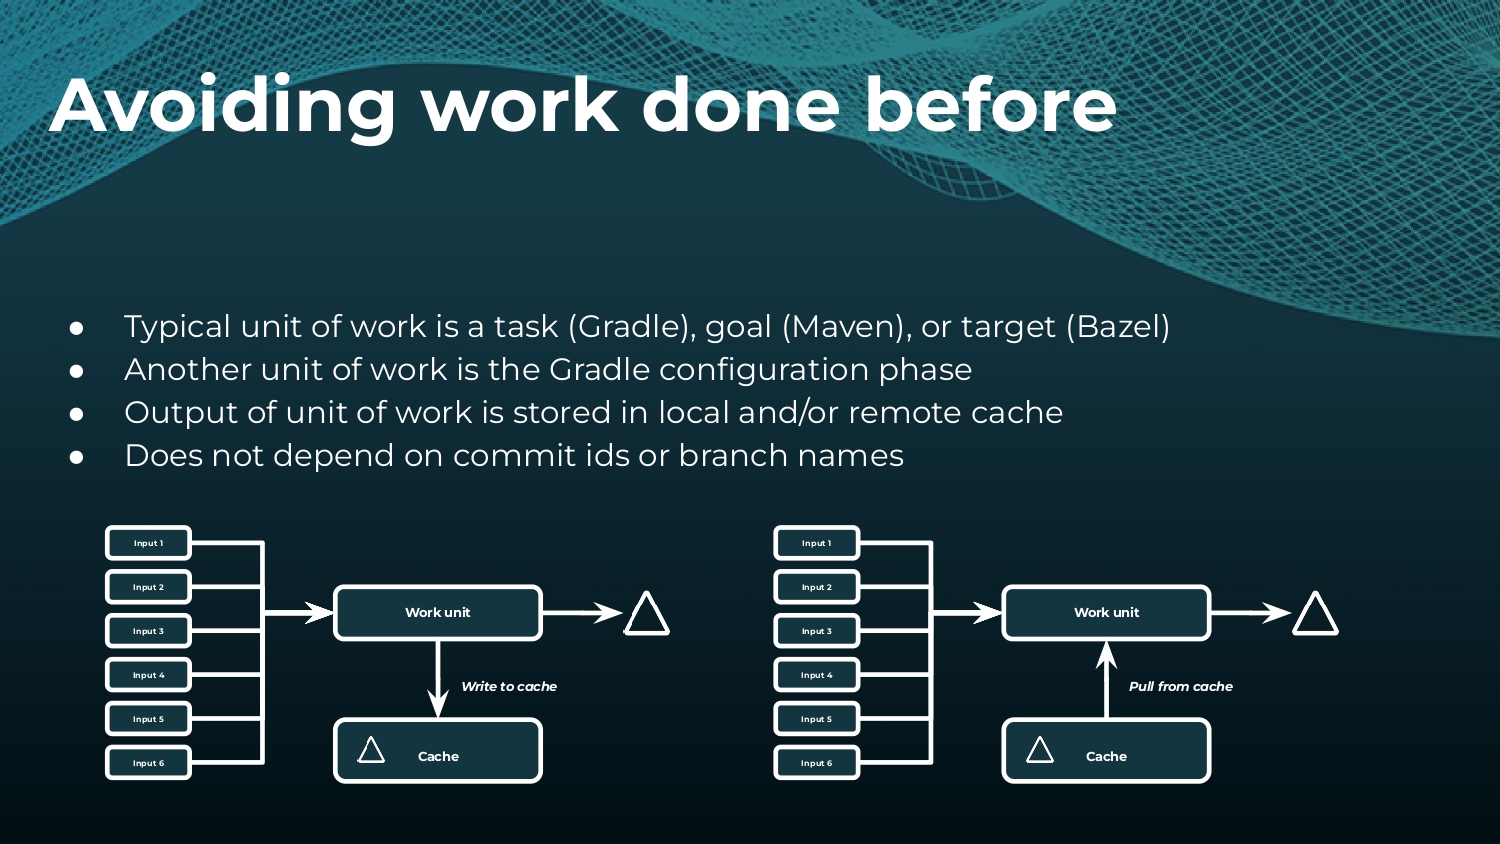
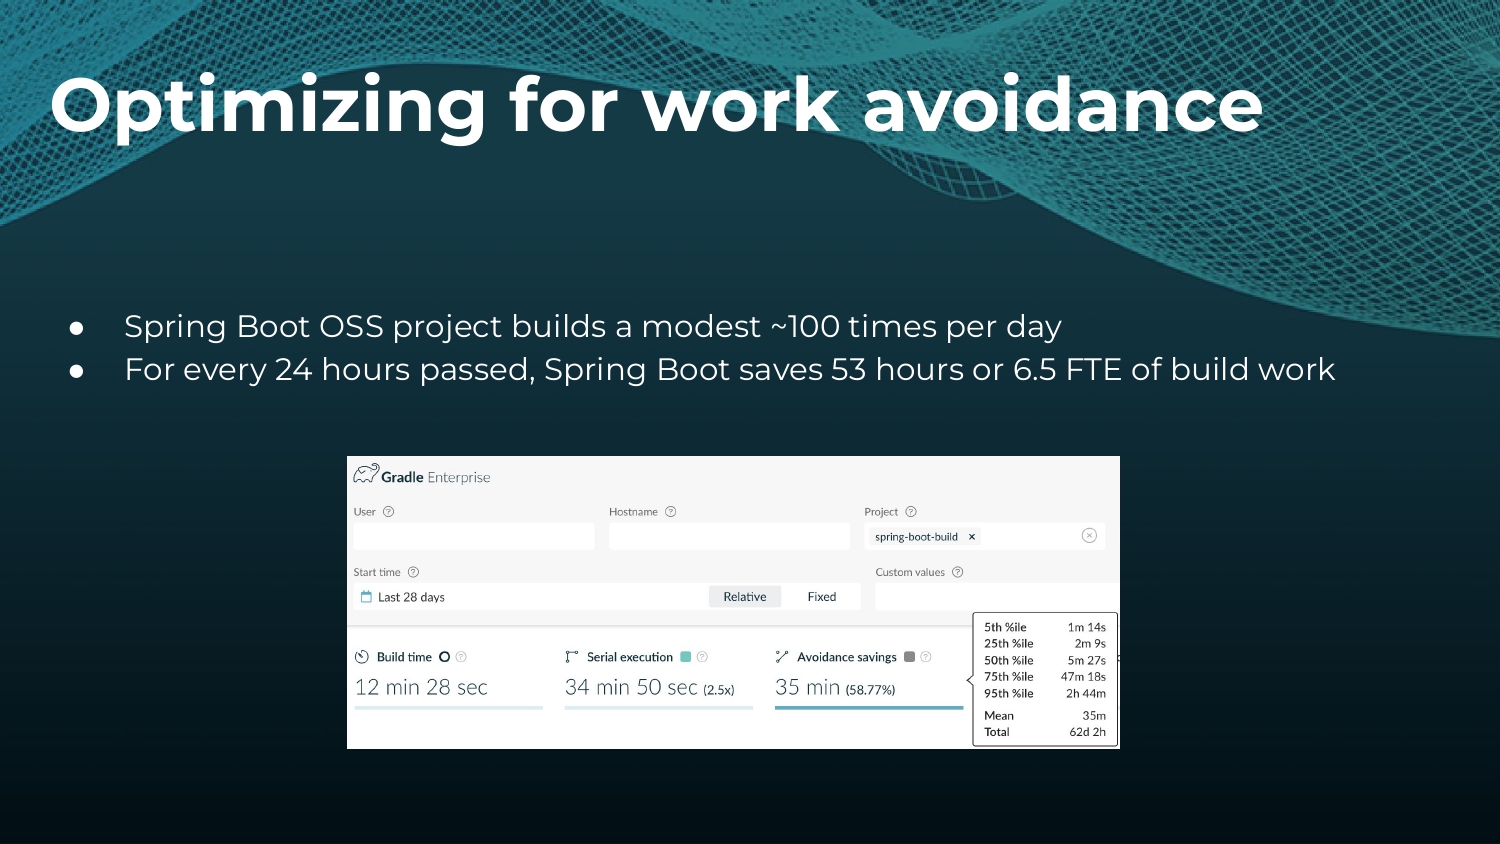
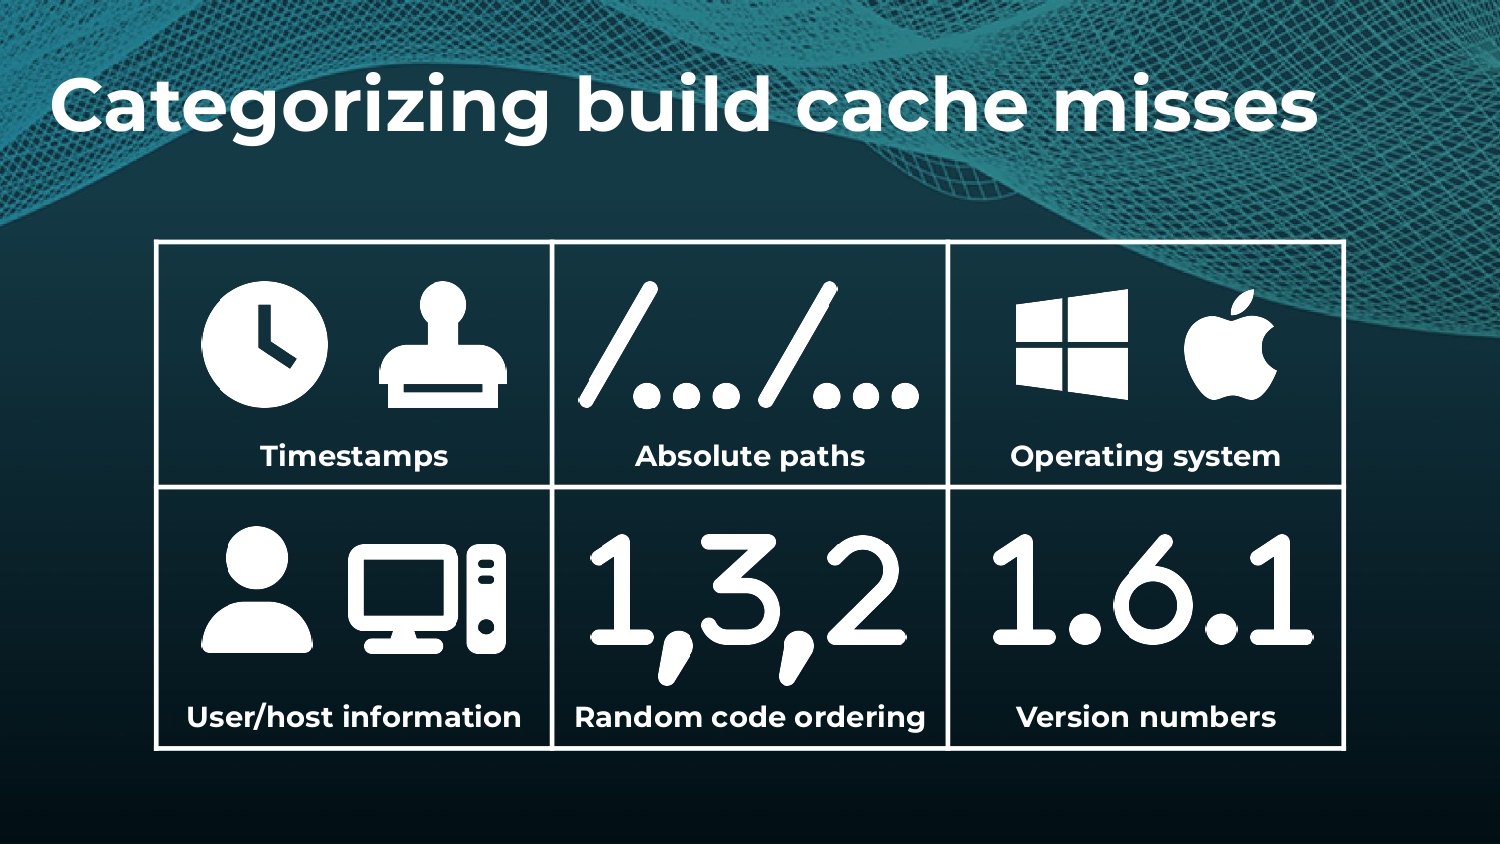
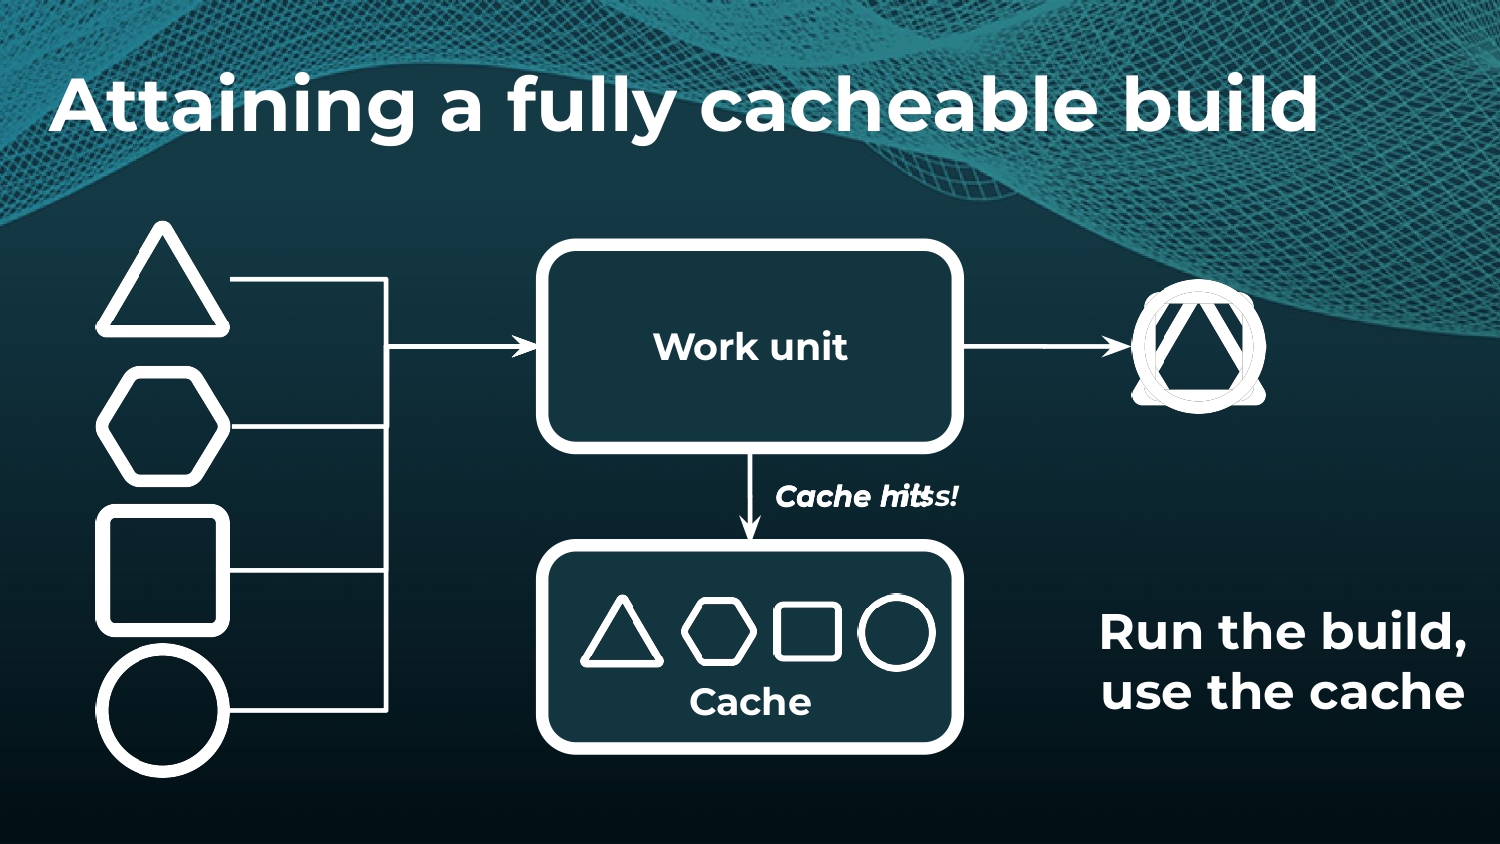
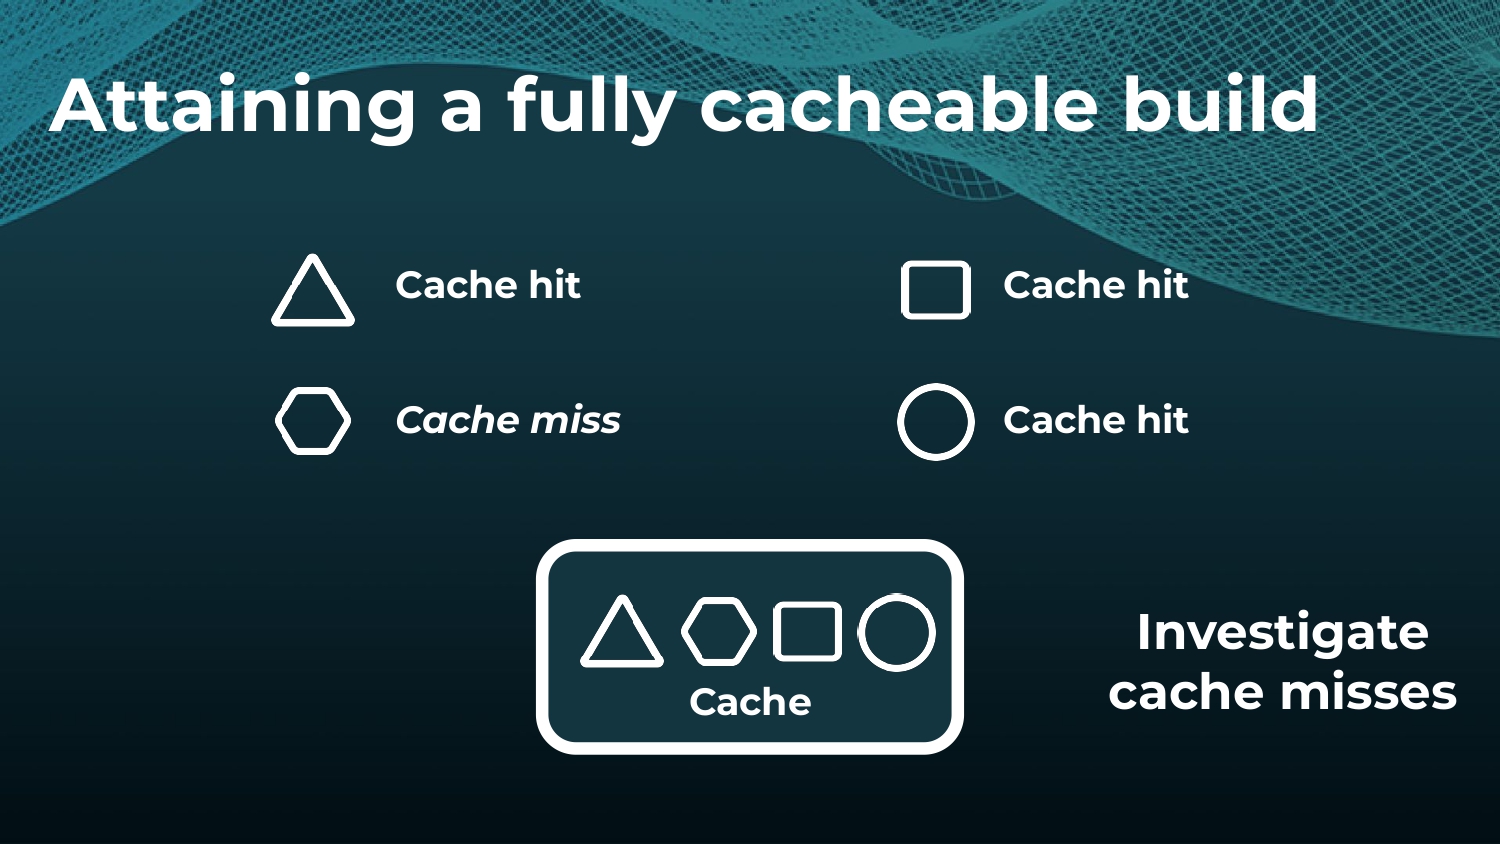
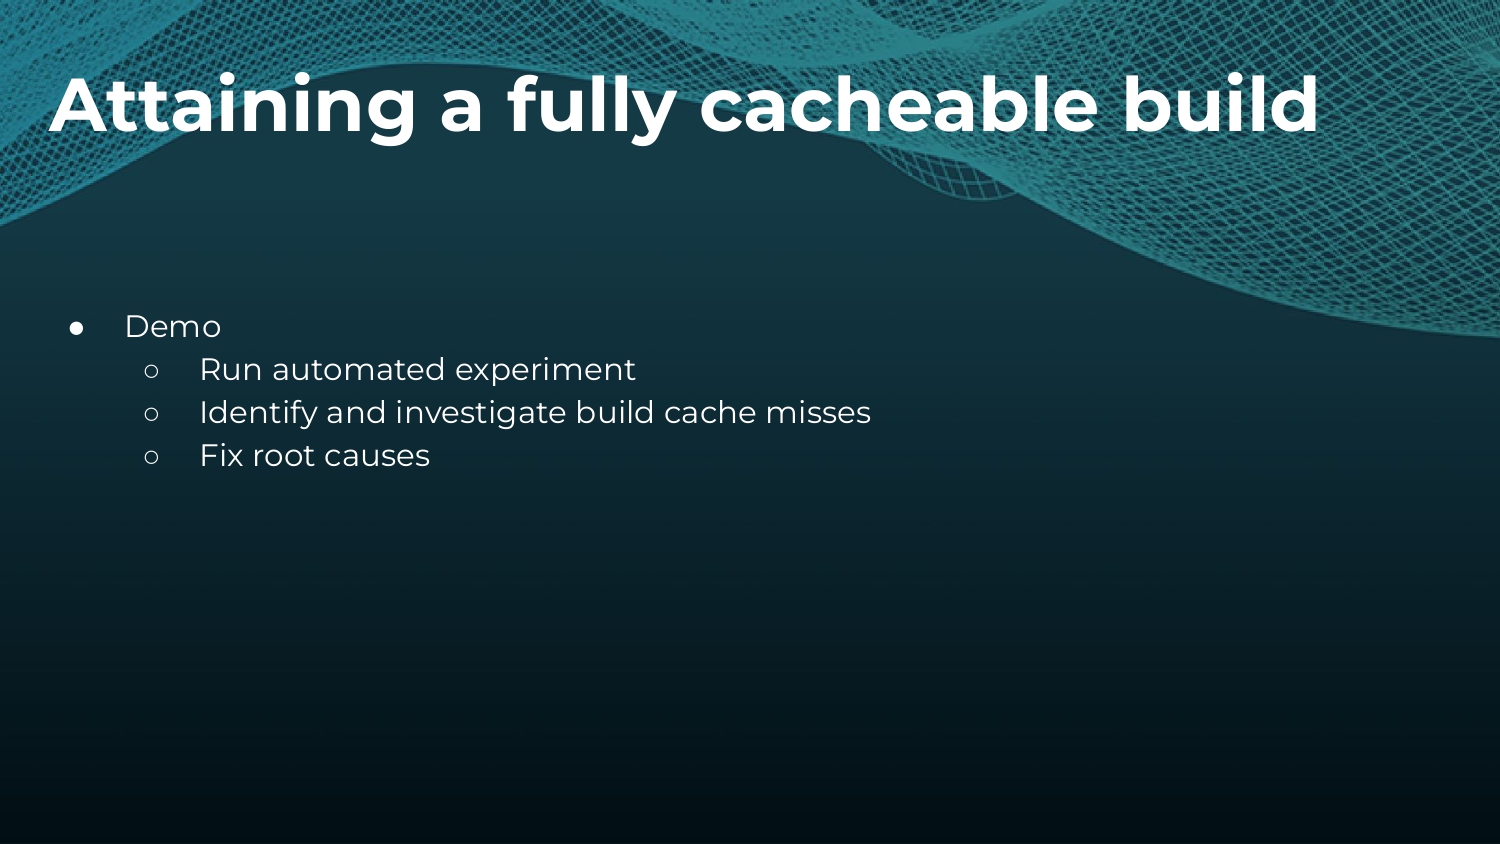
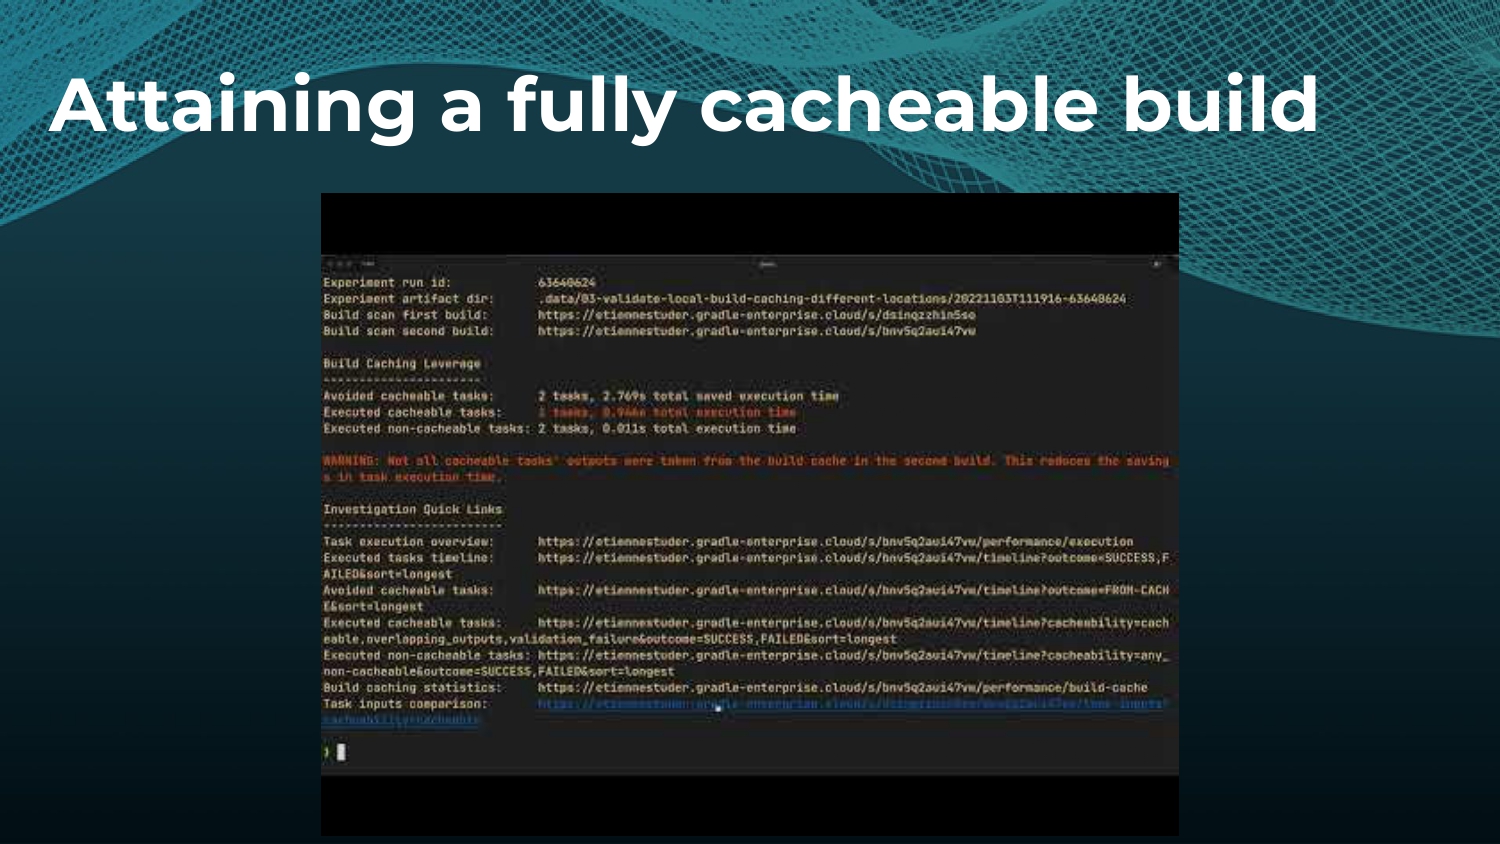
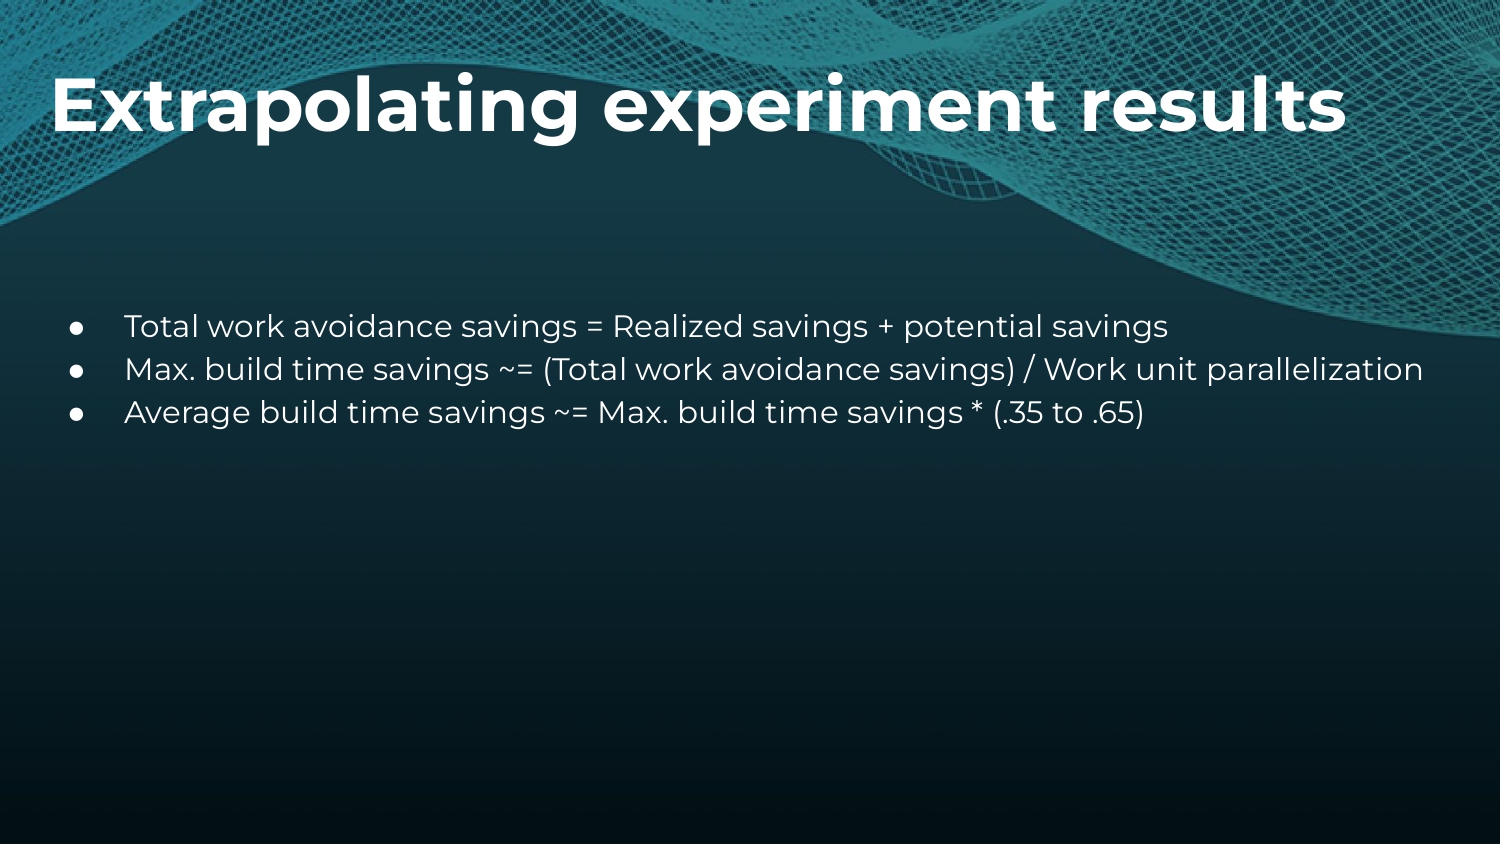
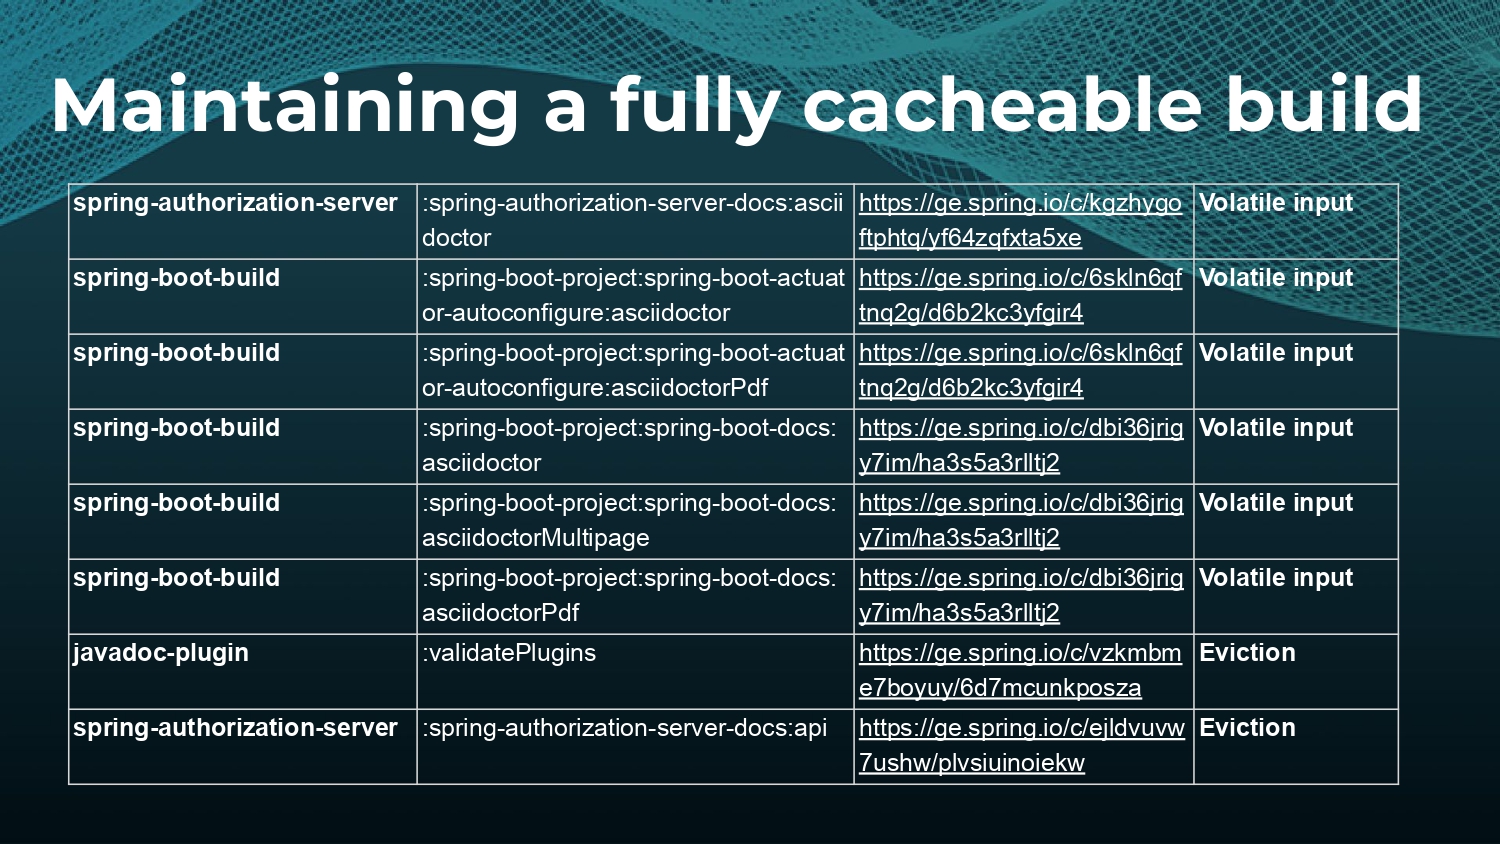
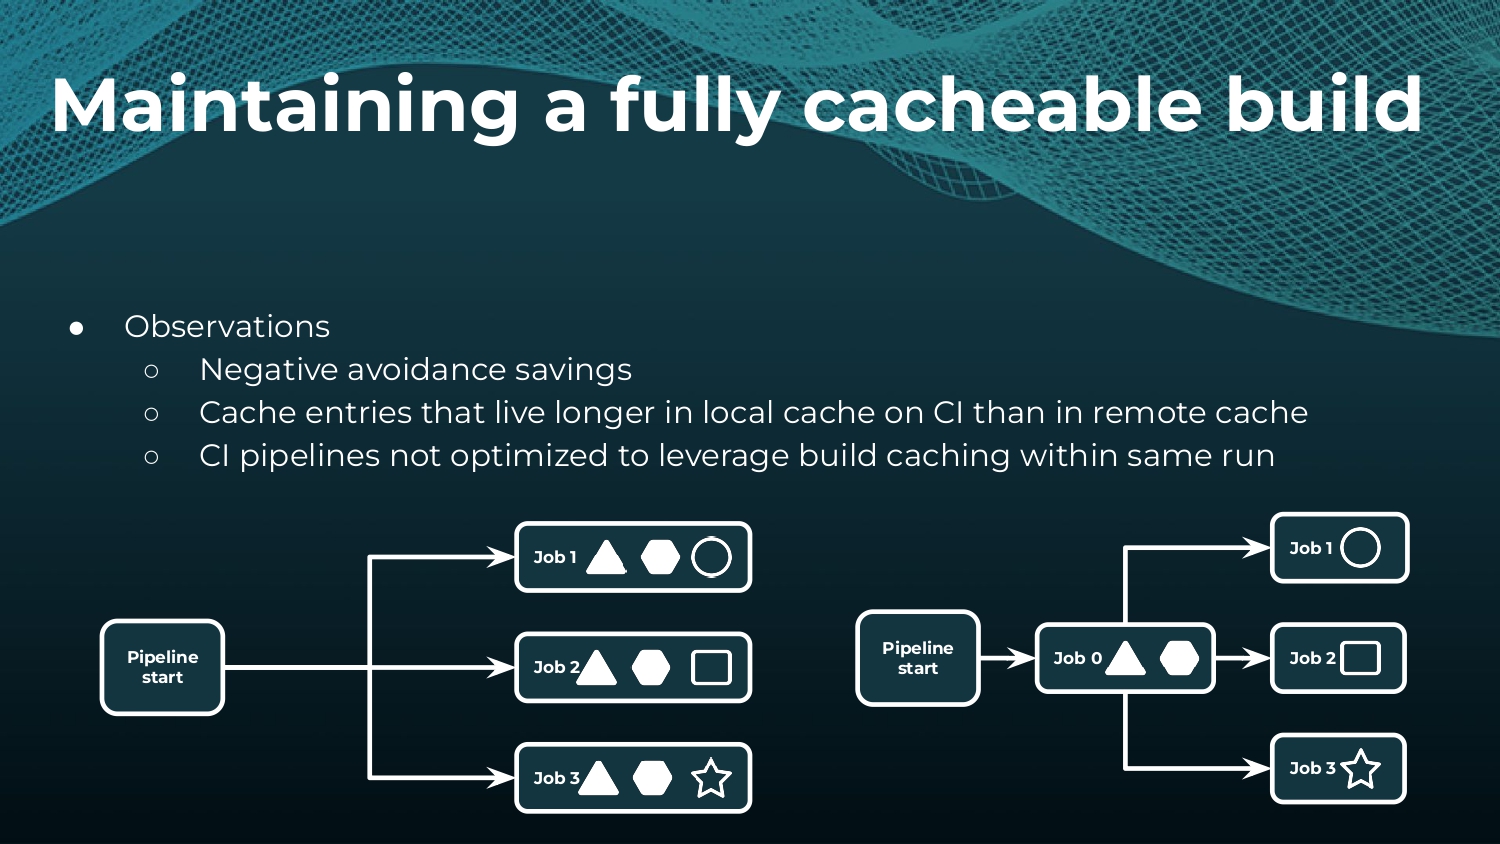
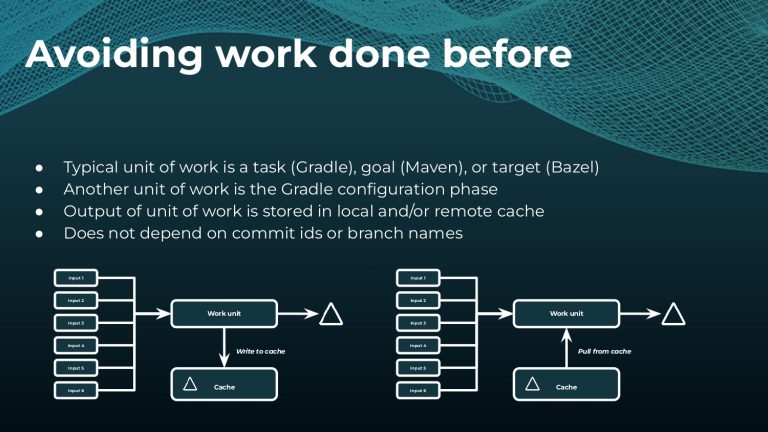
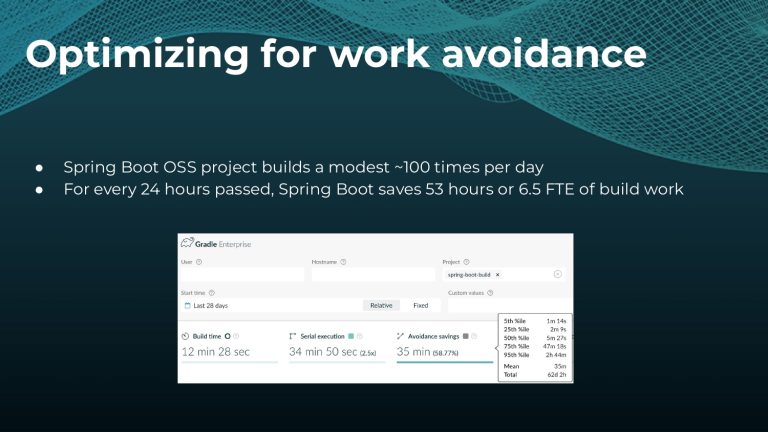
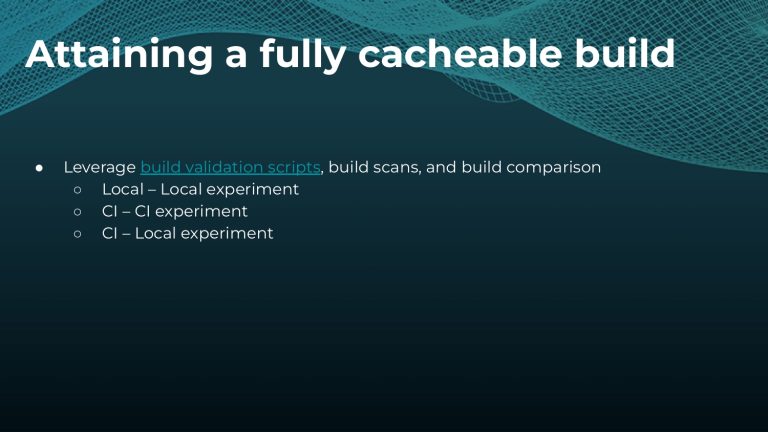
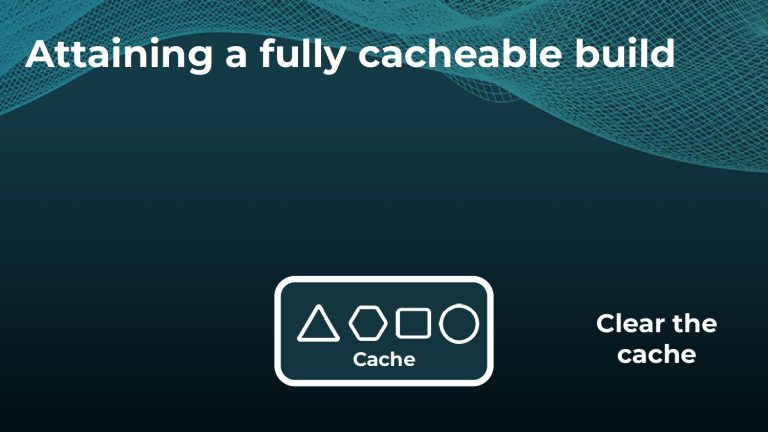
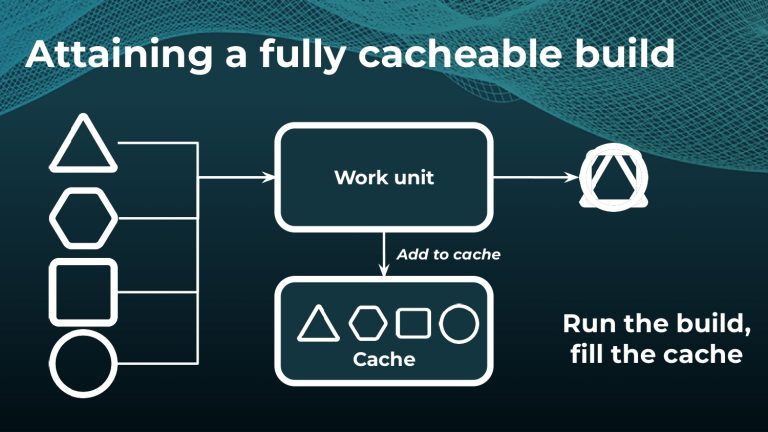
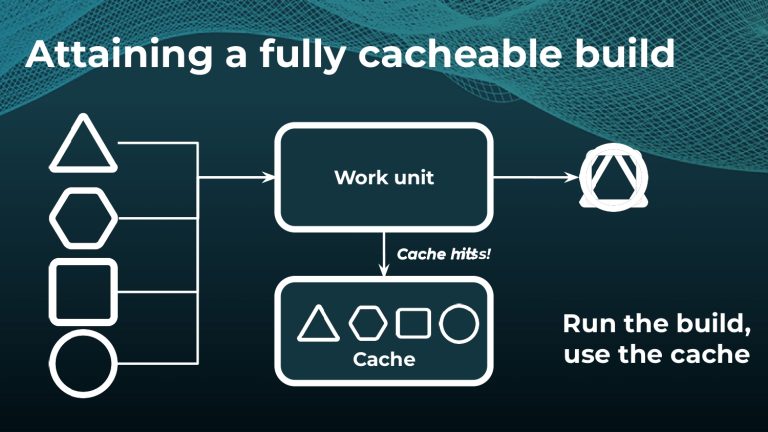
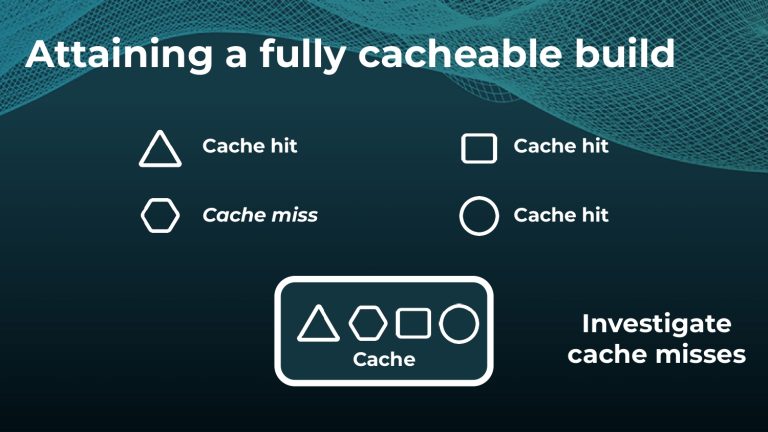
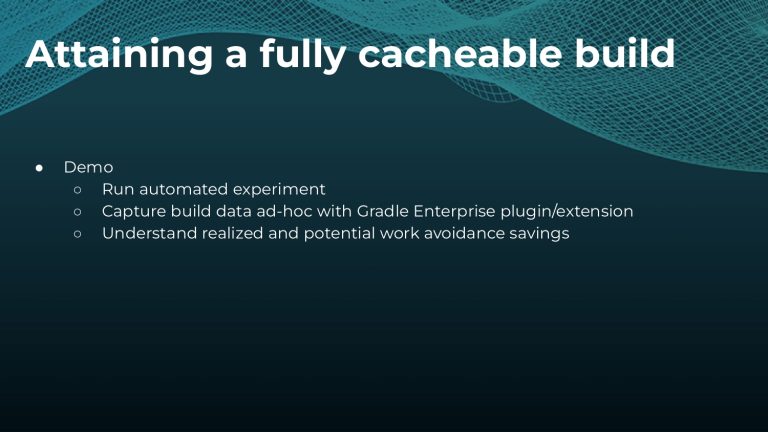
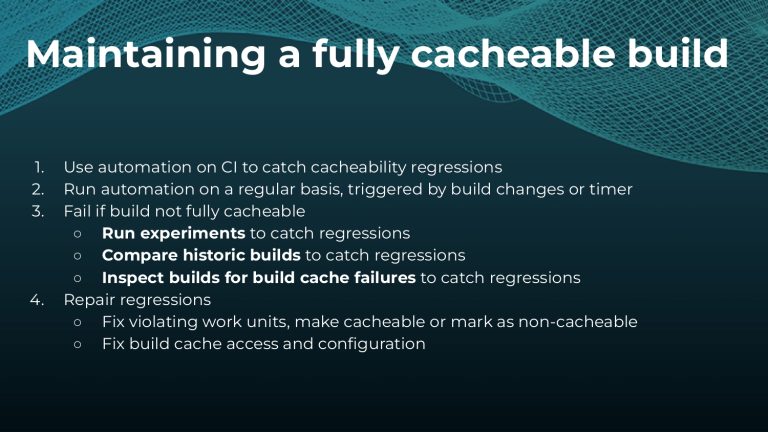
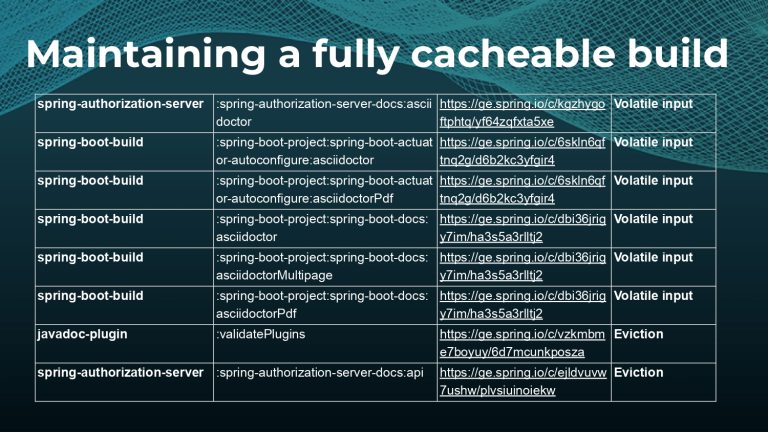
Avoiding unnecessary work with build caching is one of the first steps towards accelerating build and test speed, but it’s not a silver bullet. Development teams need data to measure and compare inputs and outputs across builds to maximize the benefits. Watch a Gradle demo on how to optimize build caching, prevent regressions, and avoid “build cache misses”, when build cache cannot be used due to differences in various factors like version number, OS, time stamps, etc. Gradle shares how to implement build caching in local and CI builds with Gradle Build Tool and Maven. We also show how Spring Boot saved 50% of build time with Gradle Enterprise.
Avoiding unnecessary work with build caching is one of the first steps towards accelerating build and test speed, but it’s not a silver bullet. Development teams need data to measure and compare inputs and outputs across builds to maximize the benefits. Watch a Gradle demo on how to optimize build caching, prevent regressions, and avoid “build cache misses”, when build cache cannot be used due to differences in various factors like version number, OS, time stamps, etc. Gradle shares how to implement build caching in local and CI builds with Gradle Build Tool and Maven. We also show how Spring Boot saved 50% of build time with Gradle Enterprise.
About Etienne
Etienne Studer joined Gradle eight years ago and has been working on Gradle Enterprise since its inception in 2015.
Etienne Studer joined Gradle eight years ago and has been working on Gradle Enterprise since its inception in 2015.
About Jim
Jim Hurne is a senior software engineer with 18+ years of experience who thrives on hard problems. Strong team leader who mentors others. Pragmatic learner who stays abreast of current trends and technologies in order to achieve greater technical and professional excellence. Expert in cloud technologies. Possesses broad experience in a variety of other technologies and platforms.
Jim Hurne is a senior software engineer with 18+ years of experience who thrives on hard problems. Strong team leader who mentors others. Pragmatic learner who stays abreast of current trends and technologies in order to achieve greater technical and professional excellence. Expert in cloud technologies. Possesses broad experience in a variety of other technologies and platforms.
More information related to this topic
Gradle Enterprise
Solutions for Developer Productivity Engineering

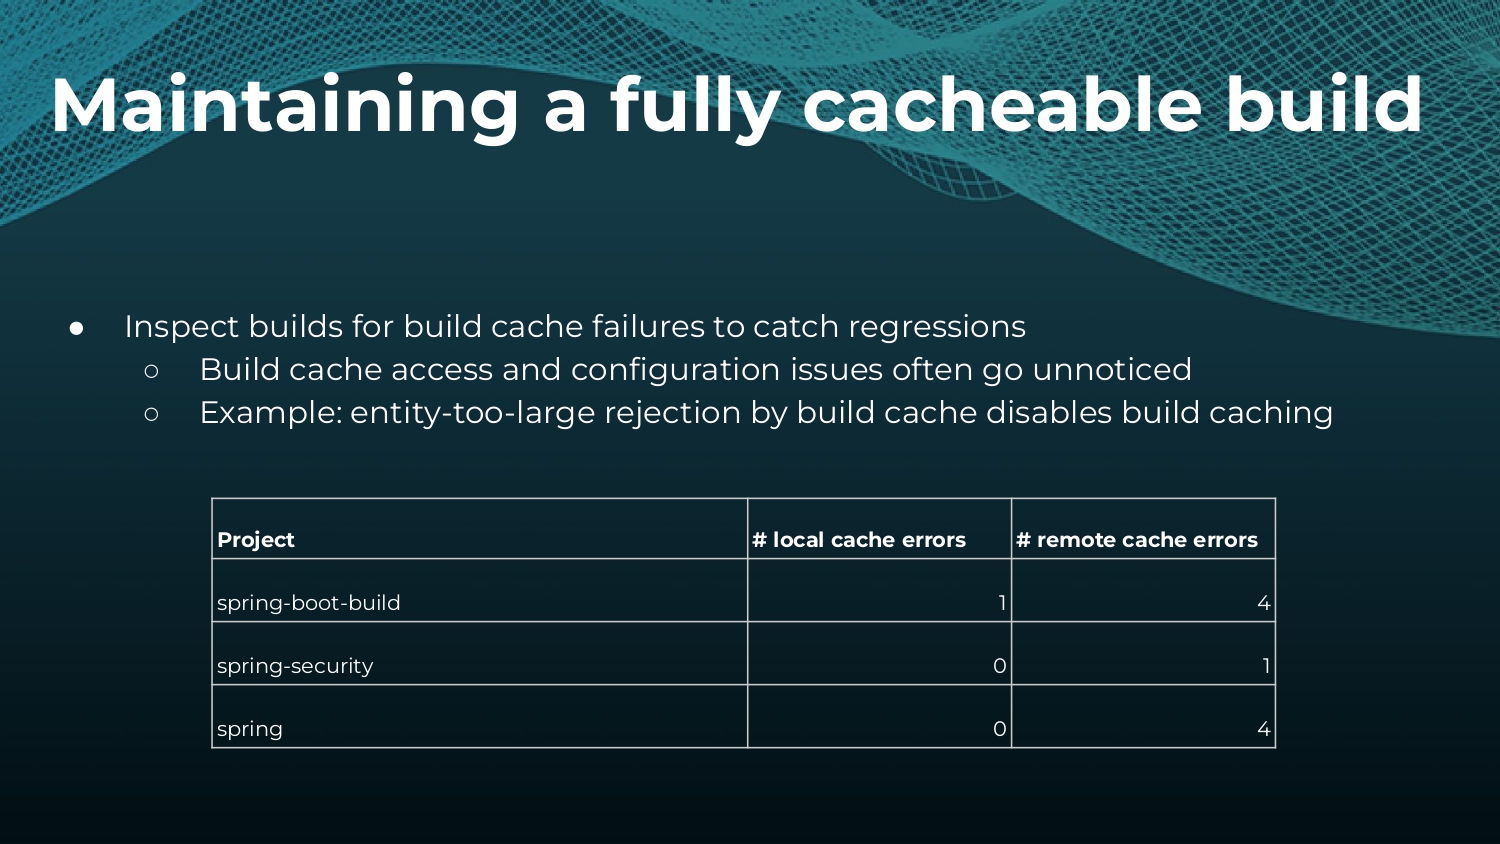
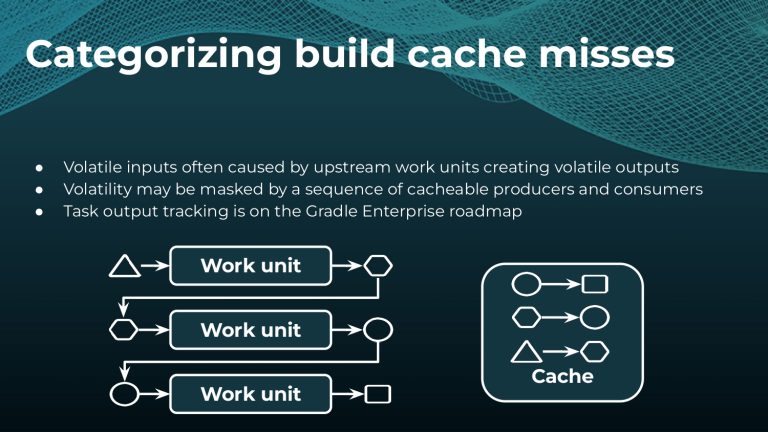
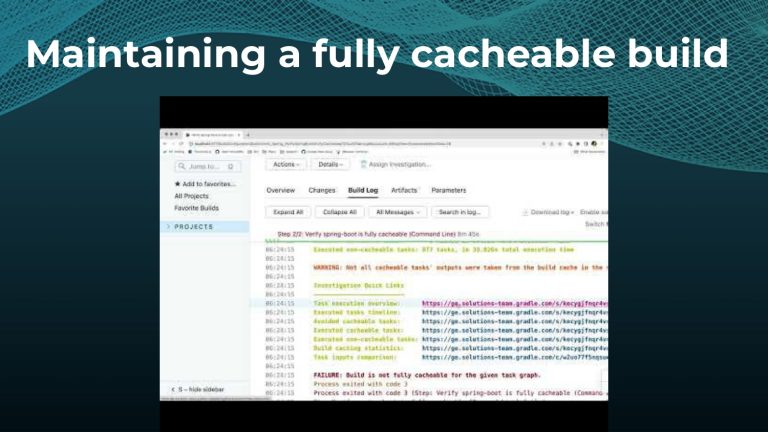
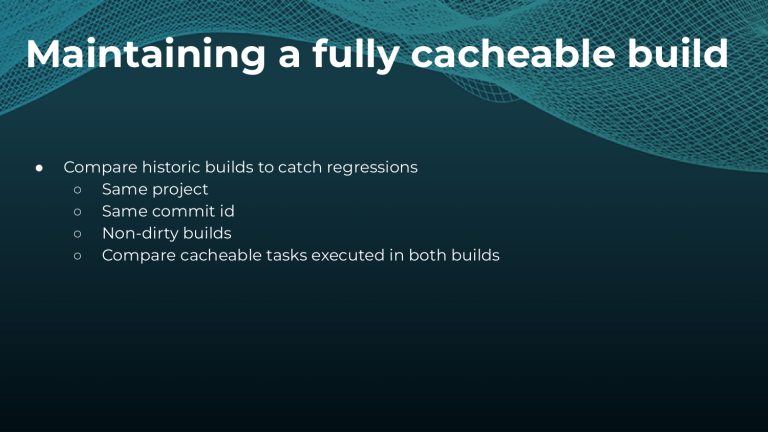
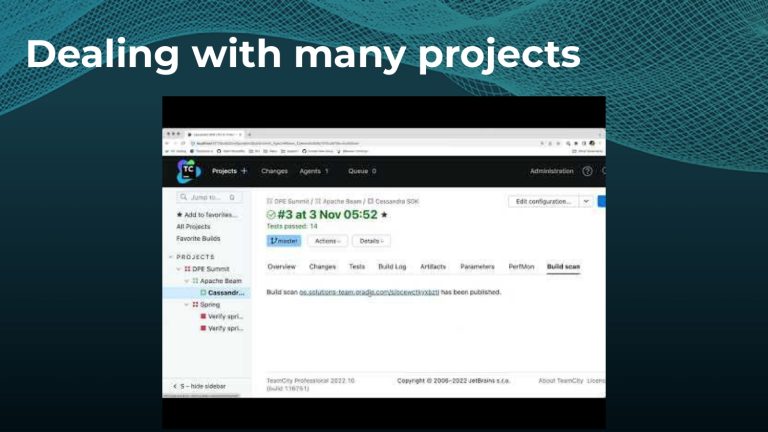
Gradle Enterprise customers use the Gradle Enterprise Build Scans and Performance dashboards to implement and tune their build cache. These tools help identify and manage build cache misses due to volatile inputs, and ensure Performance Continuity by catching regressions in cacheability before they threaten the codebase.
Slides


Interested in keeping builds fast with Gradle Enterprise?

Speed Up Maven Builds with Maven Build Cache Technology
17-min video
Tutorial: Keeping Builds Fast with Build Caching
20-min read
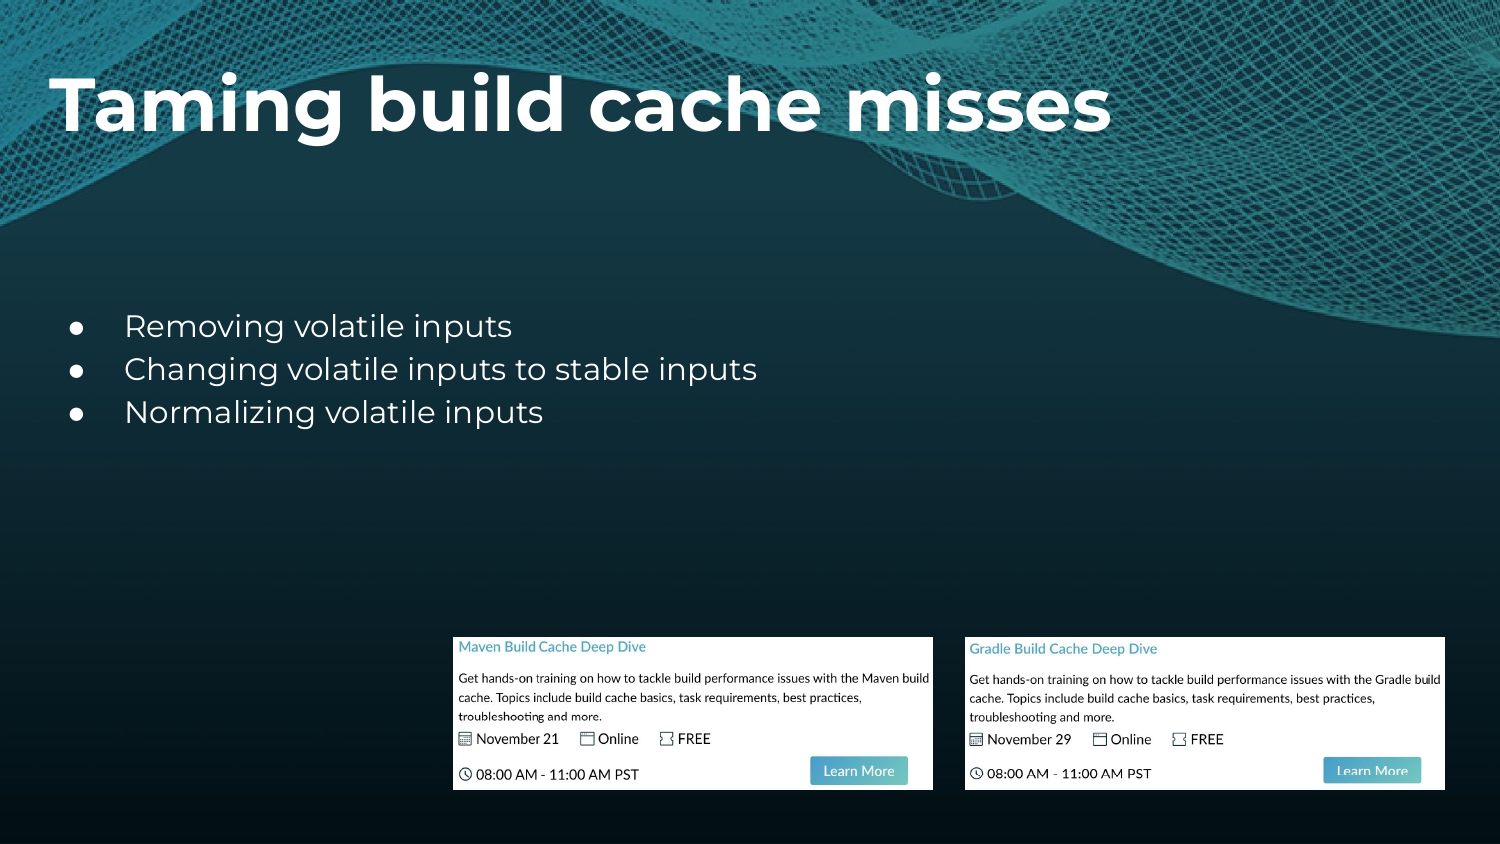
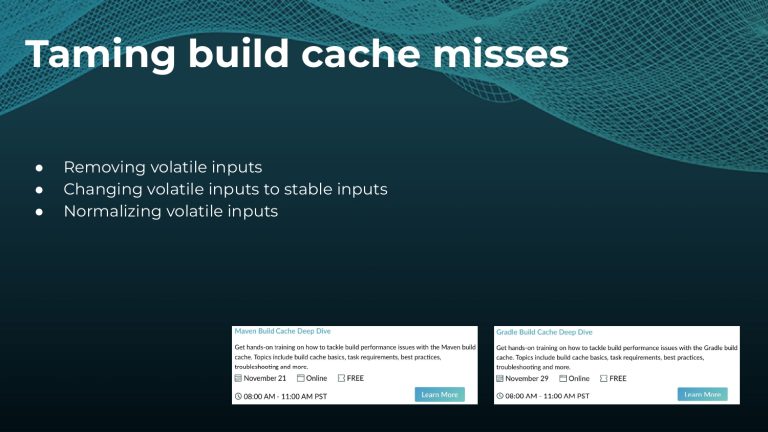
Build Cache Deep Dive
2.5-hour training