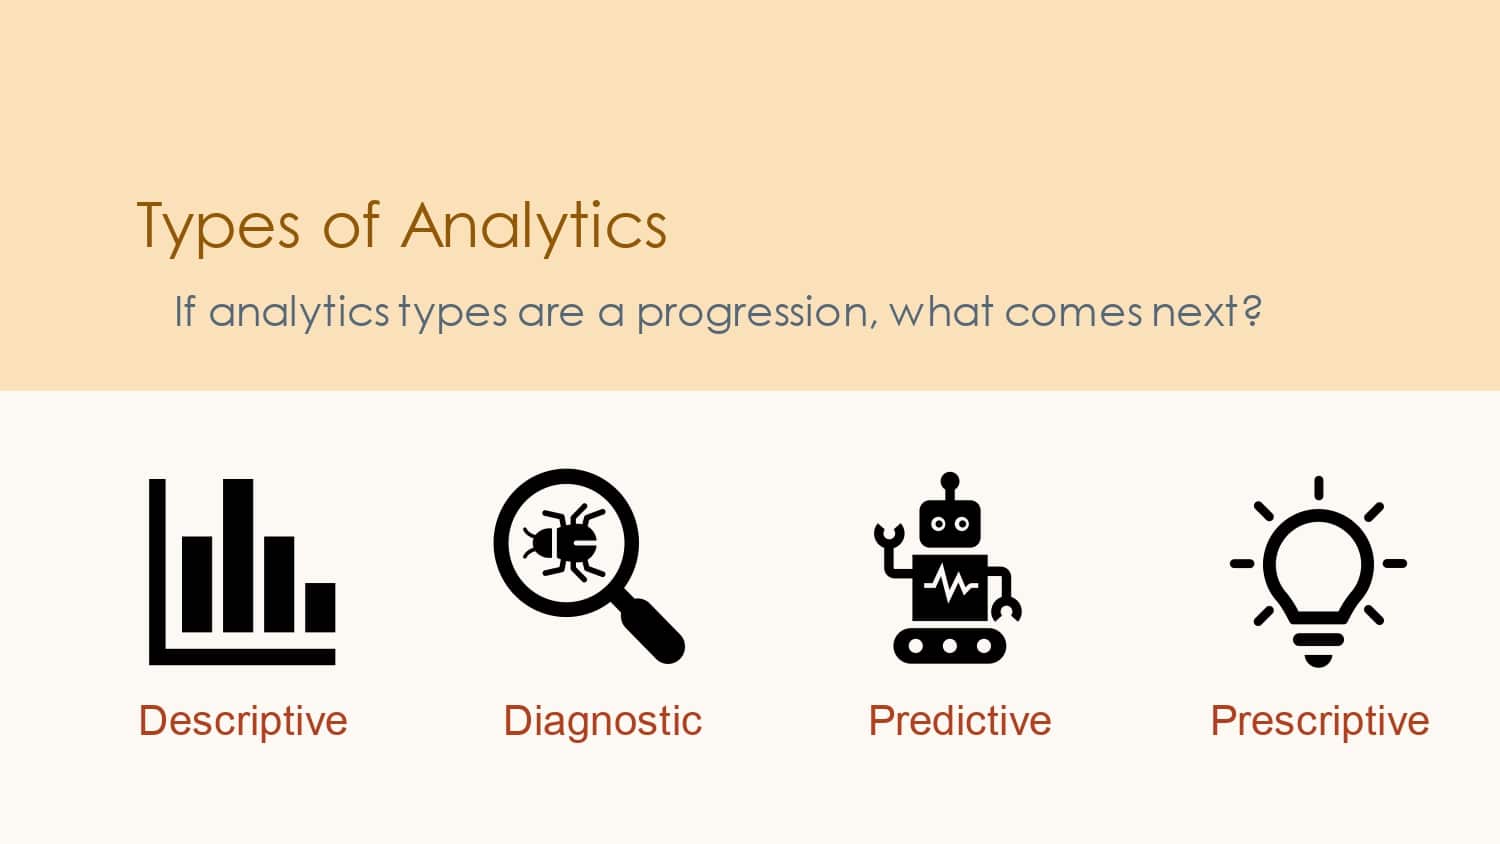
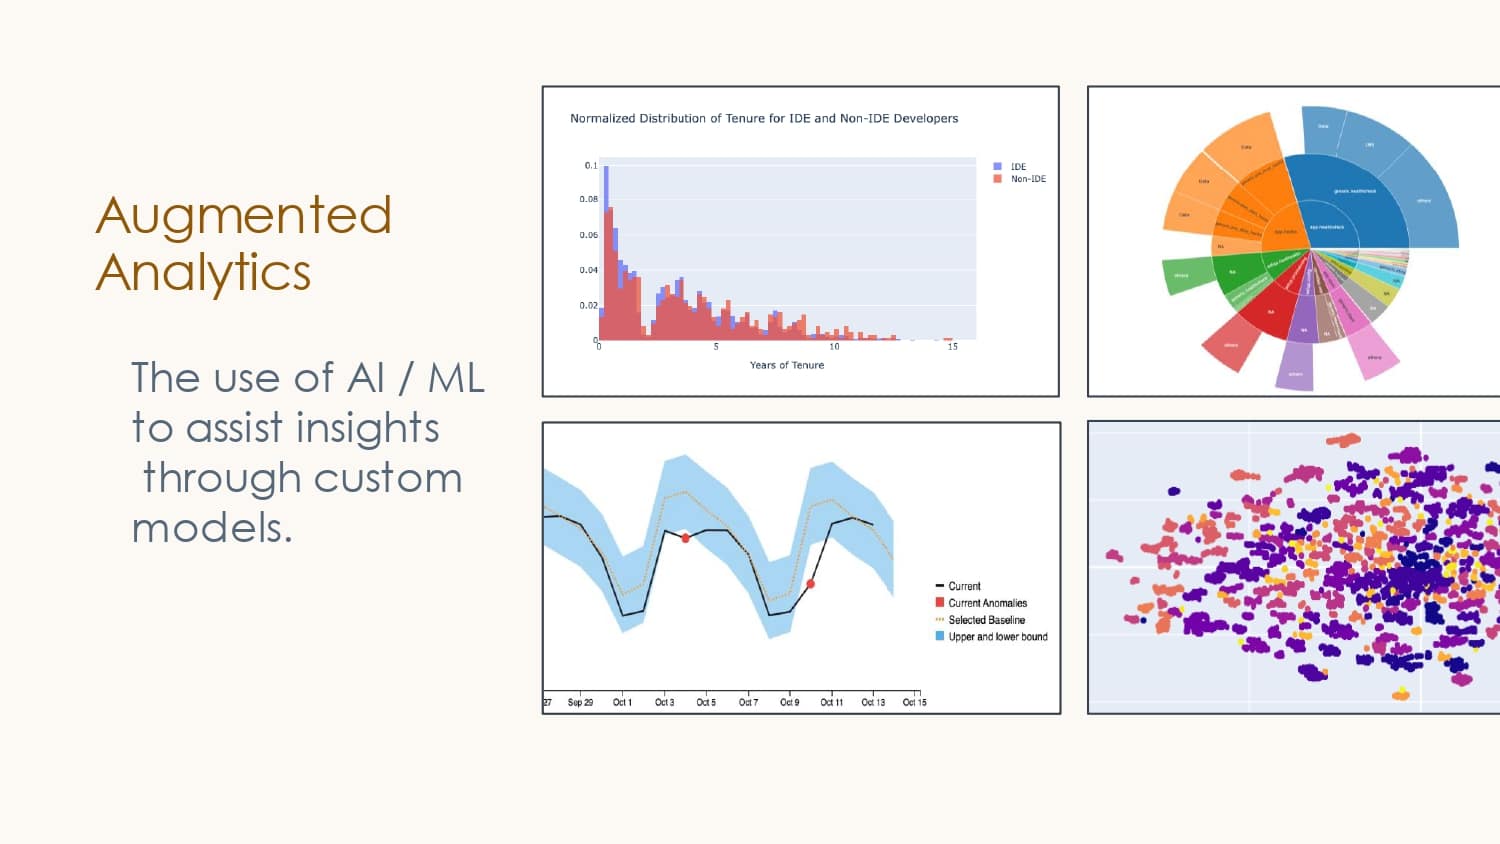
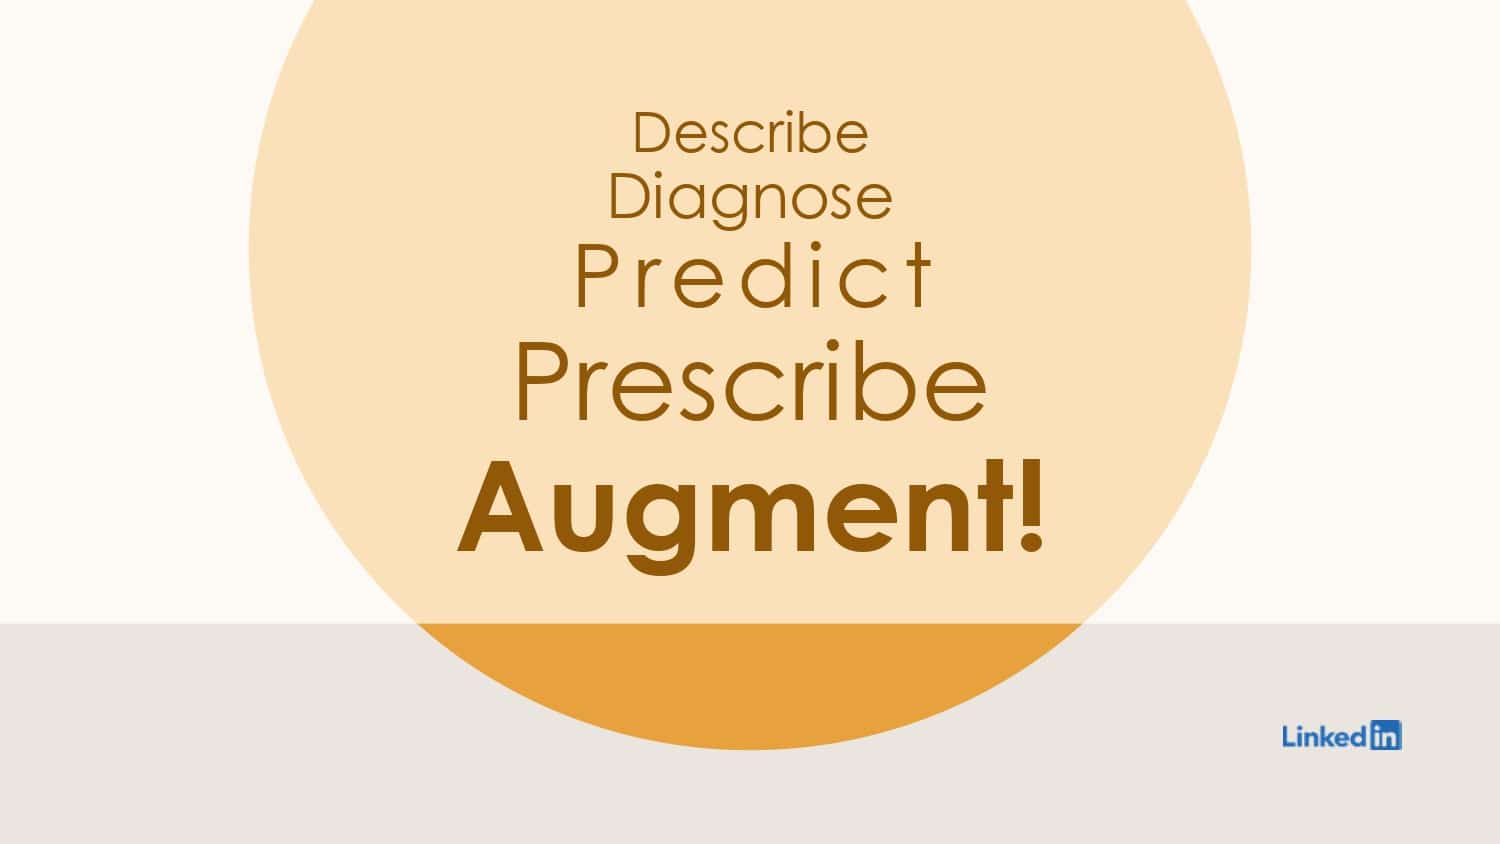
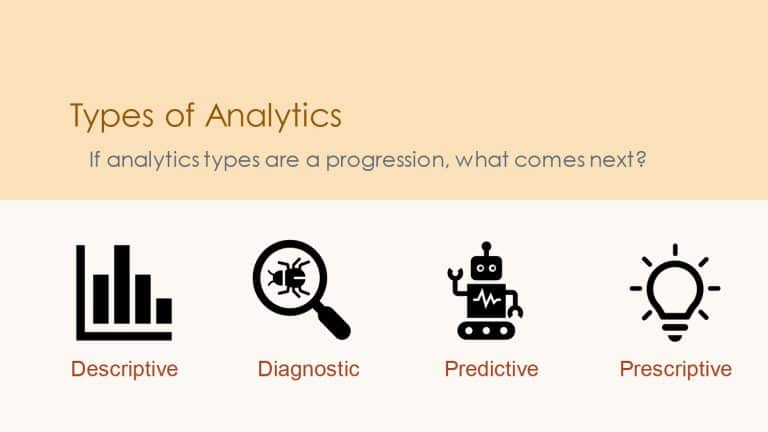
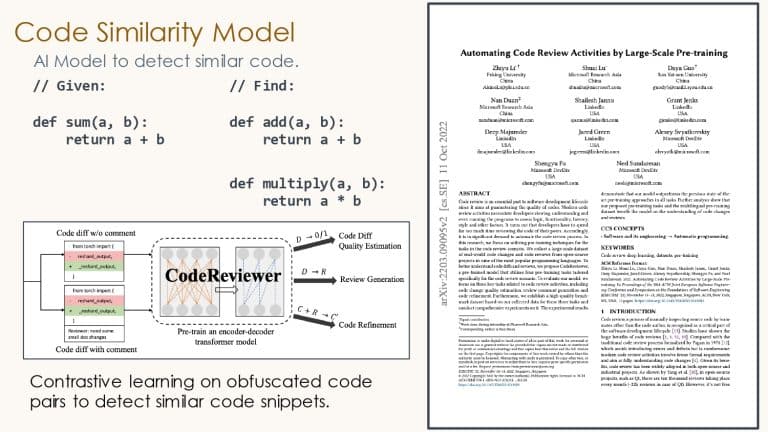
At LinkedIn, many diverse teams exist–backend, frontend, mobile, etc, each with patterns and nuances that no single team can understand. Leveraging four kinds of analytics–descriptive, diagnostic, predictive, and prescriptive–the Developer Insights team is now building next-generation developer experience dashboards that leverage modern data science and AI models.
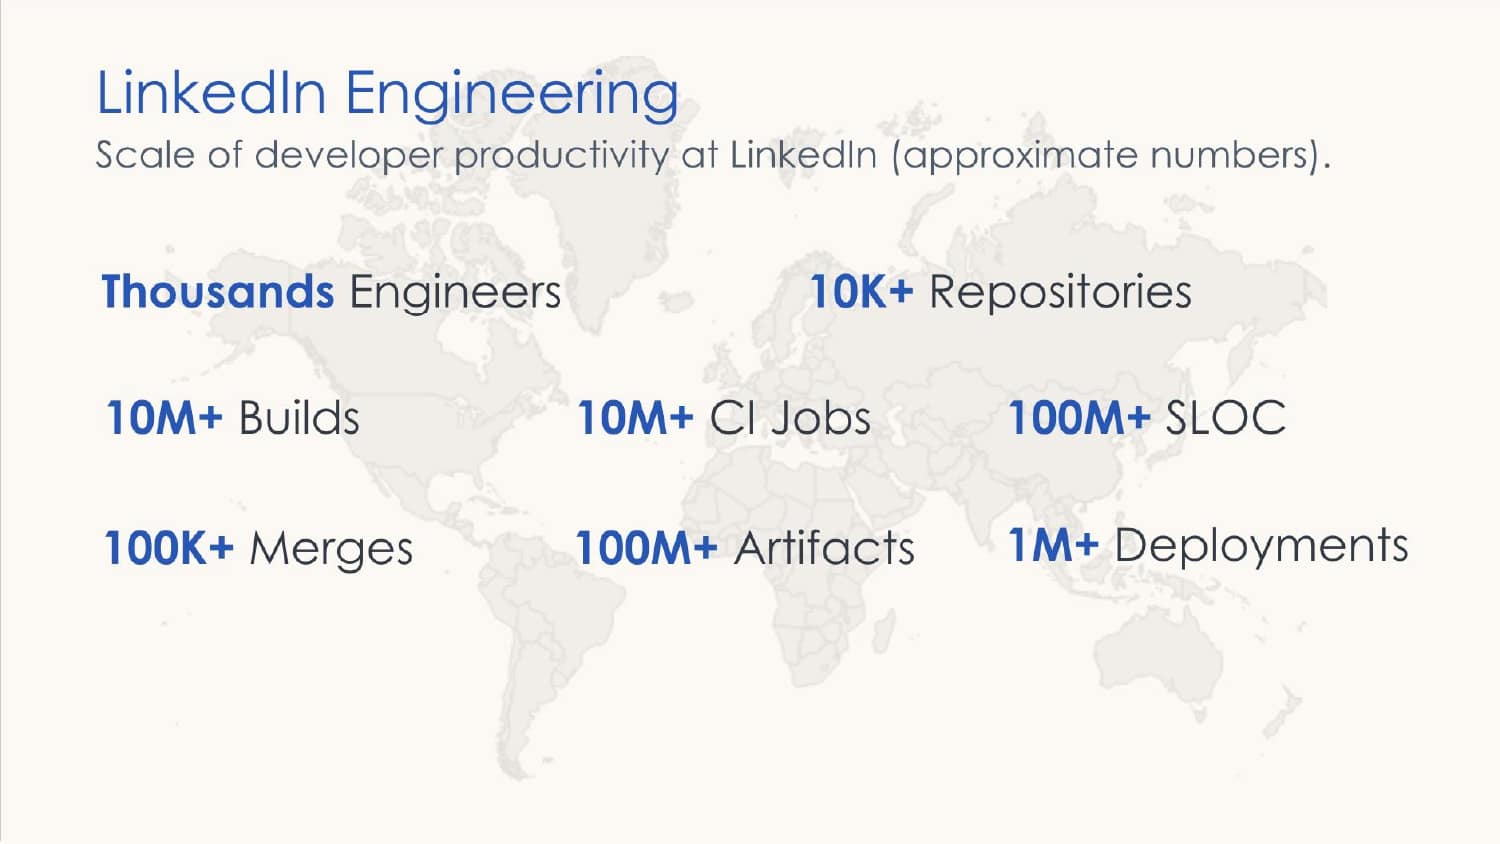
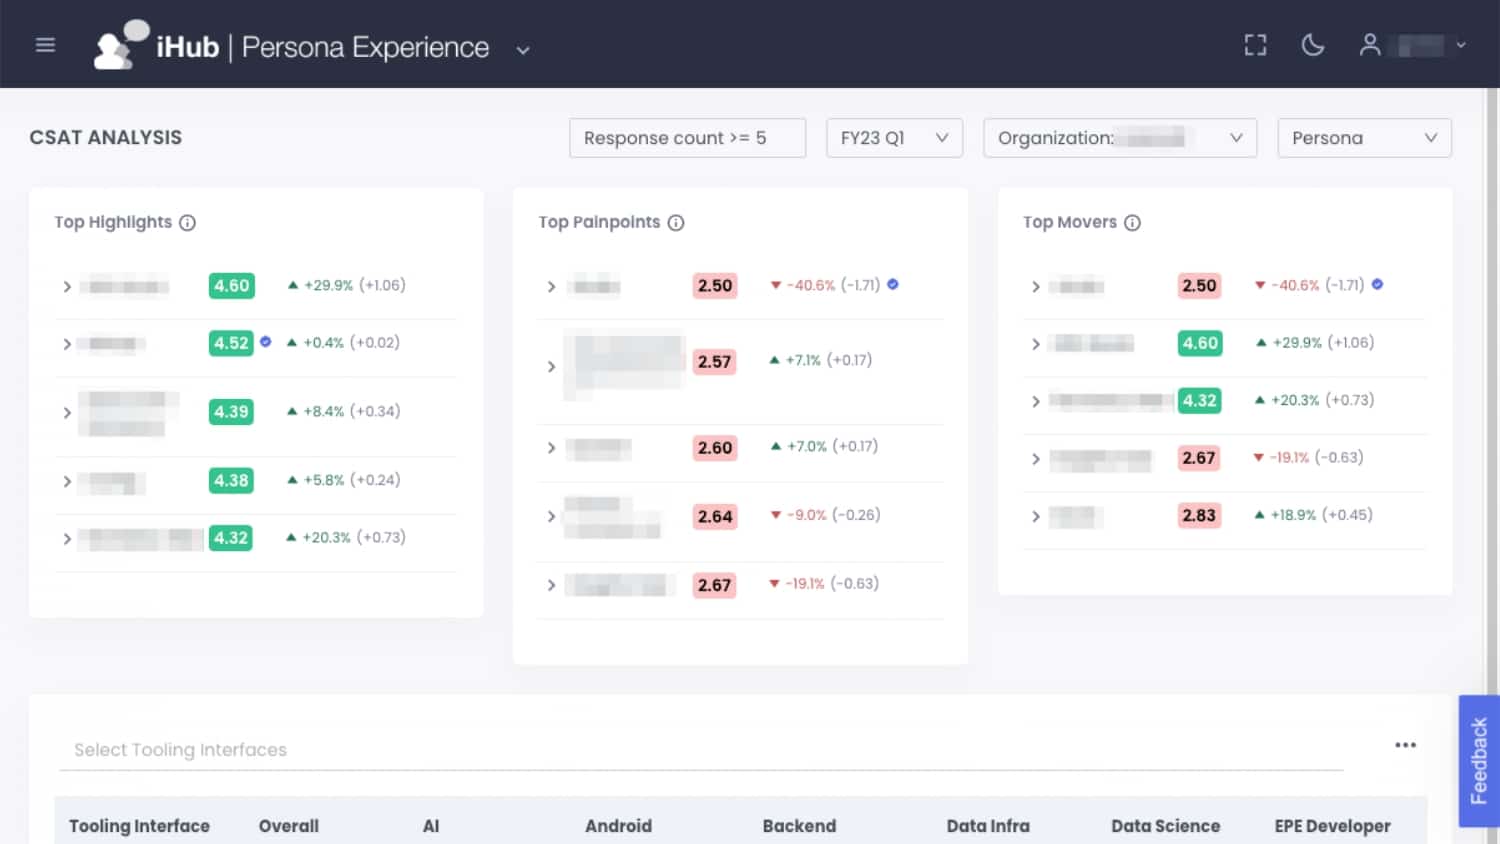
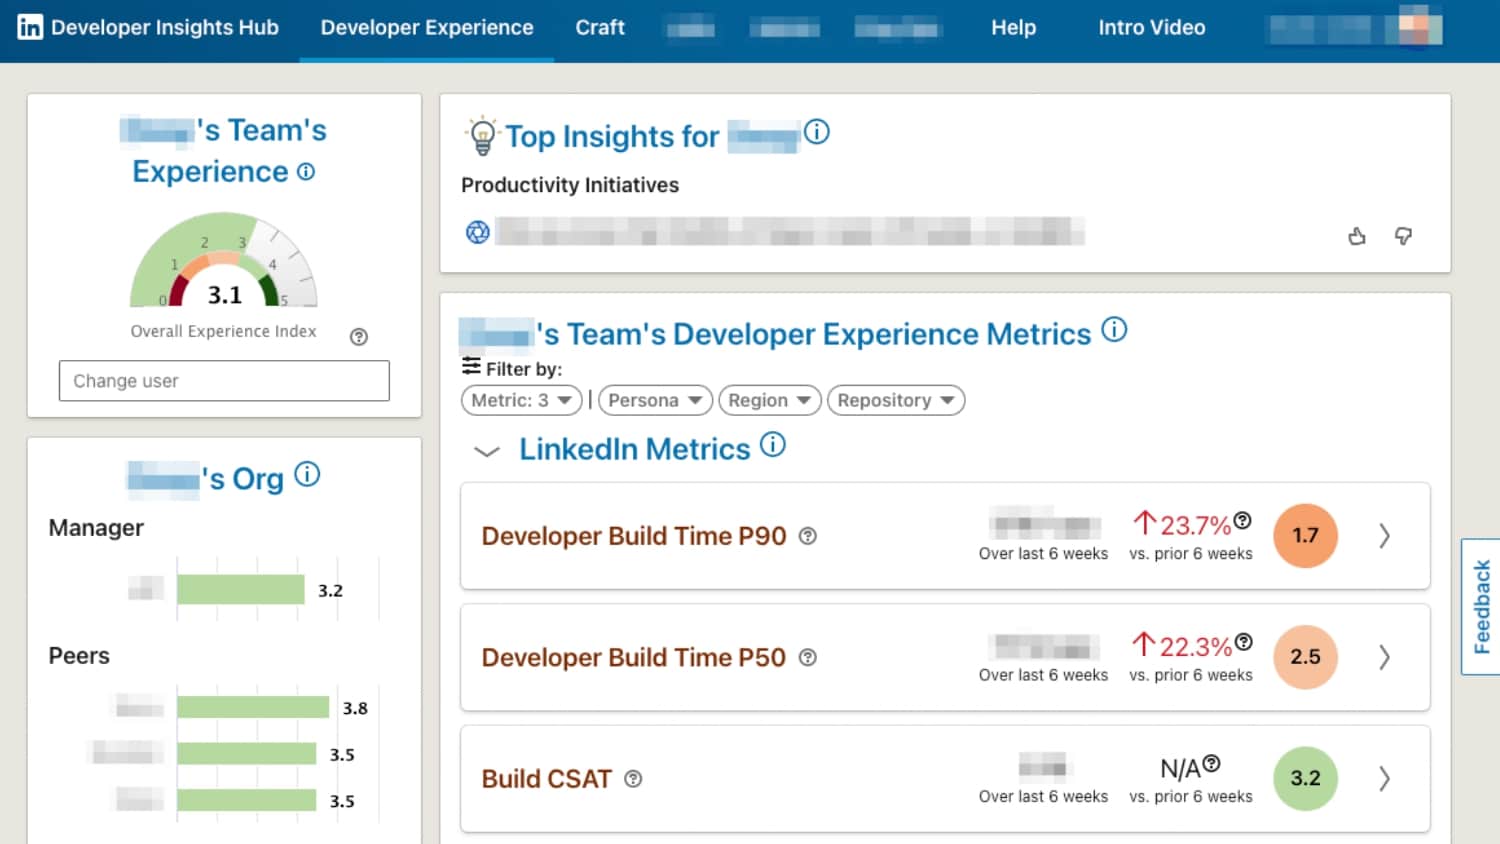
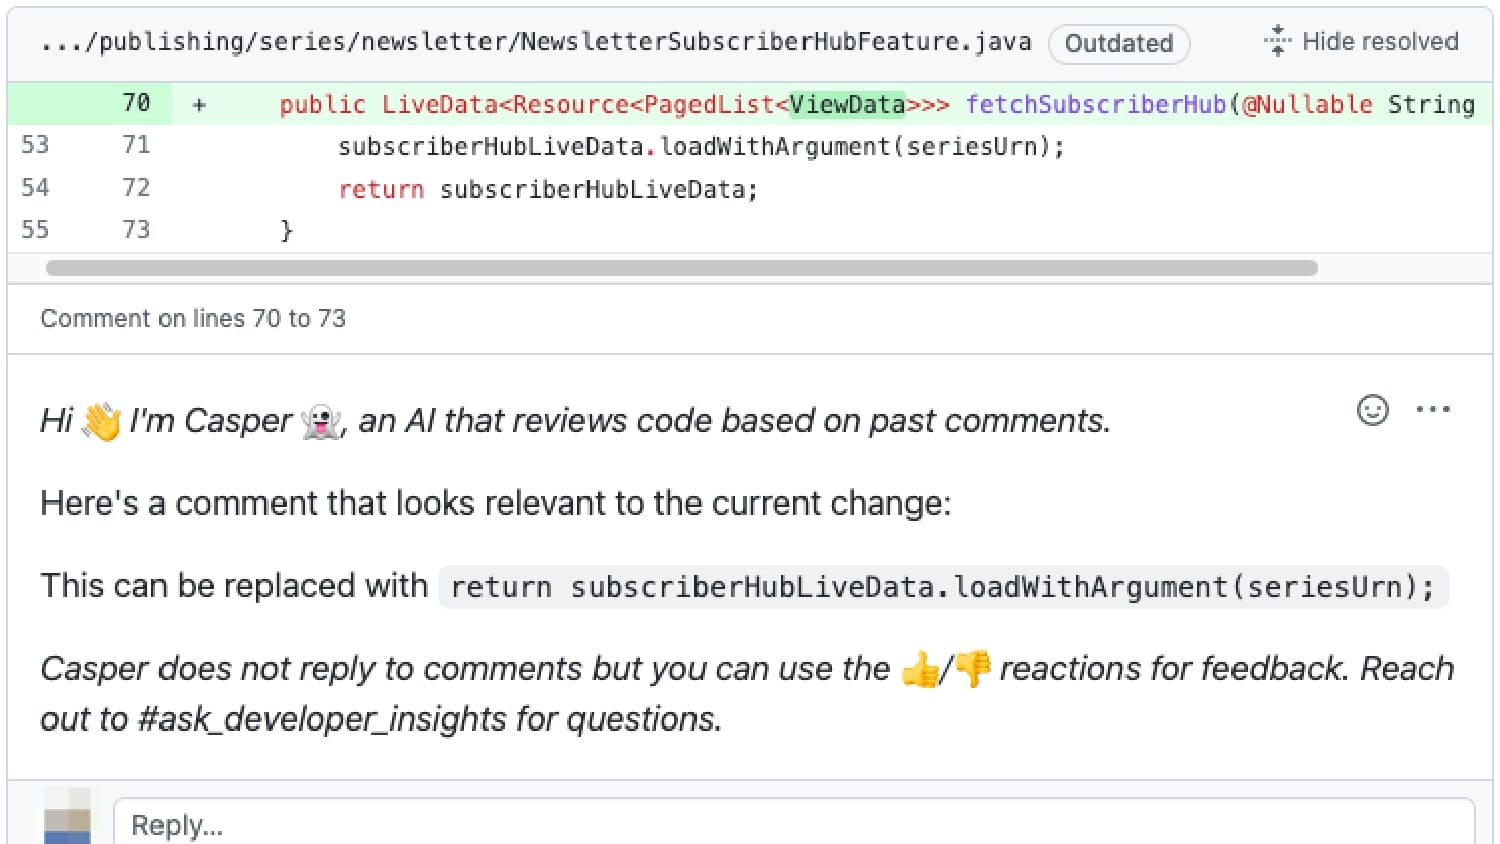
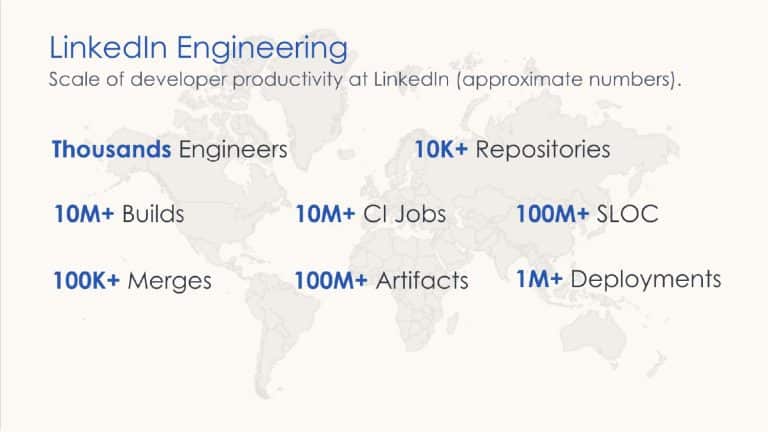
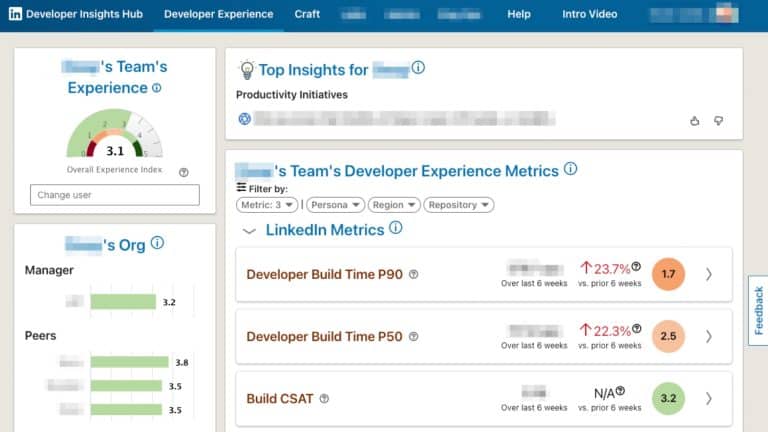
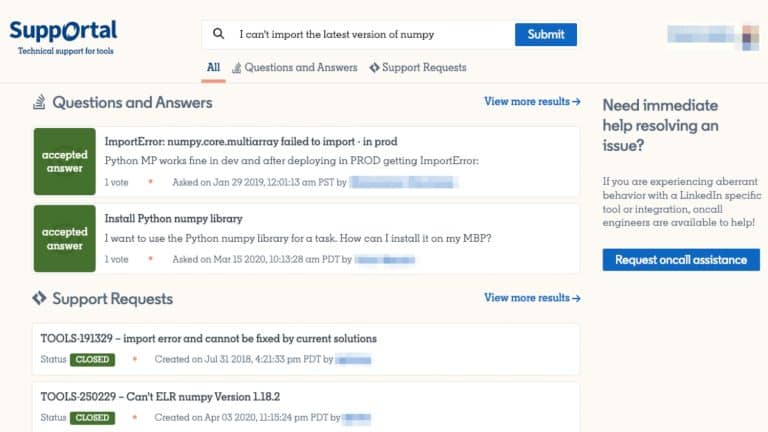
The Linkedin Developer Insights team shares how they capture observability/telemetry metrics from builds, CI jobs, merges, artifacts, and source repositories, across all developers/platforms/projects to build developer experience dashboards with actionable insights for application teams.
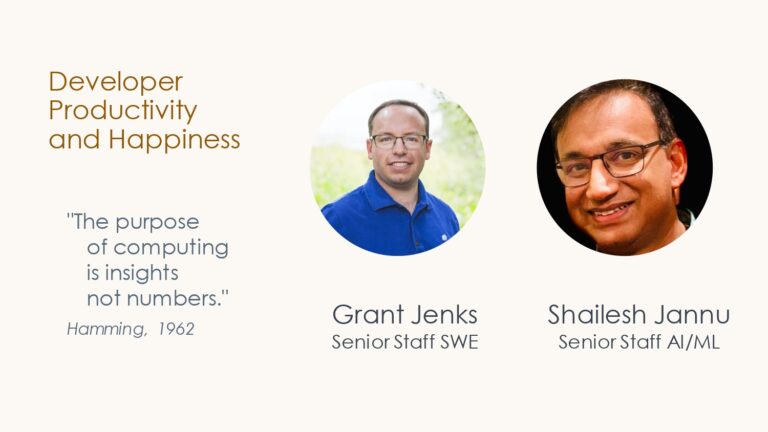
Grant Jenks is a technical leader with 15 years of experience in turning research and product ideas into high-performance software. For the last three years, he has worked at LinkedIn in the Developer Productivity and Happiness organization within the Developer Insights team. Developer Insights works like a “Fitbit for engineering teams” to identify and improve pain points in developer workflows. Prior to LinkedIn, Grant founded an adtech analytics company and applied his expertise in distributed systems and machine learning to predict search engine rankings. He pivoted from his initial role as a compiler engineer on the Midori OS research and incubation project at Microsoft to his current work in analytics.
Shailesh Jannu is a hands-on technology leader with more than 20 years of experience in engineering, architecture, product management and product development. He has a passion for developing solutions using AI, Machine learning, IoT and Big Data. He is an expert in building and releasing world-class enterprise software applications, as well as platform, middleware and infrastructure components for leading global enterprise brands.

At LinkedIn, the team uses Gradle Enterprise along with other tools to capture developer data and transform it into actionable goals that optimize developer productivity engineering efforts. You can also use the Gradle Enterprise API to collect structured data from a Build Scan™ and aggregate it across all builds and tests, whether from developer machines or CI. This data includes dependency management, system resources, and infrastructure, among other things.
Interested in Developer Productivity Engineering? Try these next steps:
- Learn more about how you can use the Gradle Enterprise API to capture data across all builds/tests run on both developer and CI machines.
- Watch DevProdEng Lowdown with Grant Jenks from LinkedIn which dives deeper into how the LinkedIn developer insights team practices DPE.
- Check out Gradle Enterprise for Developers training, to see what structured data a Build Scan captures that can be pulled out of Gradle Enterprise via the API to generate DPE/DevEx observability metrics.
Grant: Good morning, all. I guess I should say good afternoon, huh?
Everybody have a good lunch? Yeah. I thought it was fantastic. I'm excited to be
here. You are here for Descriptive to Prescriptive Analytics and Beyond for
developer productivity. So let's get started. As Rooz mentioned, we are part of
an org called developer productivity and happiness. Shailesh and I are both
senior staff engineers on the team. He is the tech lead for the data science
portion of it. He'll be sharing later today. I am the tech lead kind of for the
team overall, engaging with partner teams and with teams across the company. And
I love this quote from Richard Hemming back in 1962. He said, The purpose of
computing is insights, not numbers. The purpose of computing is insights, not
numbers. And I want to remind us today that even as we do all this discussion of
developer productivity, this is not about reducing people to a set of numbers or
reducing work to a set of numbers. This is about insights. And for us, we call
that actionable insights. Here's the scale of LinkedIn engineering. We're
talking, you know, thousands of engineers across multiple product lines and
product orgs. We have tens of thousands of repositories. We do tens of millions
of builds. These are actually local builds that developers are doing. We have
tens of millions of CI jobs that are kicked off as part of the development
cycle. There's hundreds of millions of lines of code and so on. Now, I will
caveat some of these are snapshot numbers. We're not creating hundreds of
millions of lines of code every quarter. And some of these are per quarter. So
just keep that in mind. What's most important about scale is that not everything
grows linearly. Right. We know that the number of social connections within a
network actually grows with the square of the size of the network. And likewise,
software complexity often grows, sometimes with dependencies exponentially. And
so we're in this position of trying to measure a very complex ecosystem and
trying to make sense of it. And the way I think about these numbers is kind of
like like if you think about the weather, you have thermometers and you have
barometers and you have altimeters and you have things that are measuring
salinity and all these different kinds of things. And together those paint a
picture for you of an ecosystem. And so that's kind of how these numbers are for
us. These are different kind of indicators. But by themselves, they don't tell
us much. This is how we see developer productivity. This is kind of the what
framework, if you will. This is what we're trying to measure.
Developer productivity is broken down at LinkedIn into three different
components. There is the happiness. I call this the satisfaction, it works
better in the acronym The Happiness of Developers. How satisfied are they? This
is fundamentally qualitative, right? We need to ask people, are you excited to
come in to work in the morning? Is the tool working well for you? Are you glad
that you're using it? We also ask how effective are our tools? And sometimes we
boil that down into a success rate. When you do a build, how often does the
build succeed? When you submit a CI job? How often does the CI job succeed? When
you and we even think of that in terms of reliability, you know, there's some
parts of CI that teams are responsible for, like your test you're responsible
for. And there are some parts of CI that we're responsible for, like you're
checking out the code as part of the CI job. And when you check out that code,
if that fails, we need to page someone who's on call to address that as quickly
as possible. A lot of these metrics are both component and aggregate. We know
the success rate of an individual test, and we know the success rate of the
overall CI workflow that works also for the last one here, efficient. That's all
about durations. How long did that take you? Also fundamentally quantitative and
we measure things like how long did it take to get an individual response to a
code review or to an update to a PR in even the larger context to of how long
did it take for the whole PR to go through code review, get merged, go through
CI, get ready for deployment, get deployed and then go out into the world. So
these get broken down into both component and aggregate metrics. There's a whole
nother framework actually for the how of how you come about, like how do you
make these? We call that goals, signals and metrics. And what you don't see
here, I think this is really worth calling out. What you don't see here is you
don't see volume. The count of builds, the count of pull requests, the number of
deploys. That's not something we put a ton of emphasis on. Do we know the
number? Absolutely. We have to know the number. But we don't go and put it in
some big dashboard. We don't email it to engineering managers across the company
because ultimately we're about velocity, not volume. And there's a whole set of
quality metrics that are not really part of today's talk. But we could go
through all the usual suspects of coverage. Meantime to resolution, meantime to
detection and everything else. This is one of my favorite charts. This is a part
of descriptive analytics. This is showing the Gradle build download speed over
time. So under the x-axis here is weeks, and on the y-axis is internet bandwidth
speed. And what you see is that the company experienced a massive slowdown. You
can maybe guess what that slowdown was. This was shelter in place. You all have
terrible Internet at home compared to the office. And that's one of the things
we had to compensate for and even invest in differently. I want to say also a
big thanks to Gradle Enterprise because it was Build Scans that gave us this
kind of data. If you're interested, we actually are having a talk. Tomorrow, 11
a.m., Shivani and Swati will be doing a talk about remote builds, and we'll talk
about how we completely eliminated this problem. I don't just mean how we
improve things. I mean how we completely eliminated this problem. We have tried
to completely get rid of cold builds at LinkedIn.
This next slide here is a little peek into our qualitative assessment, our
qualitative measurement. What you're looking at here is a bunch of CSAT scores
for different tools. We have a personas framework where we kind of divide
engineering into mobile engineers, backend engineers, SRE types, tools
engineers. And then we go and we assess, hey, what is their opinion of this tool
or this service or this workflow? And we gather that feedback on a constant kind
of basis. What's important to us is that we gather that feedback as quickly as
possible and as relevantly as possible. You know, imagine if you went on an Uber
ride and then three months later you are asked for your opinion about it. That
is too often how these surveys kind of work. So we have a framework in place so
that just as you finish something, we can kind of get your feedback on it and
all of that rolls up here. What's not pictured here is the hundreds of
dimensions that are also recorded, things like the size of a change, the size of
a PR, the region, or the time zone that the author or the builder is in download
bandwidth. As we've seen, that's all part of this framework. Now we have tried
to move into predictive analytics. This was something that we called the
developer journey. And the developer journey meant that we tried to track what a
developer is doing as they go through their entire day to day flow. It's kind of
a mess, right? I mean, you look at this chart and you think, wow, what
developers do is chaotic. They're moving all through different kinds of systems
and things. And there's no huge pattern that emerges here. And we had honestly
kind of mixed results with this analysis. It taught us a lot of new things, but
it didn't work the way we wanted it to. We had really hoped that we'd be able to
create what's called a next best action type platform where we could predictably
recommend to developers, This is the thing you should do next. And as we
analyzed this, we realized that's not going to be possible. It is interesting,
though, from a refer perspective. If you're familiar with the Internet, you know
that we track links, we track visits across different websites. If you start to
think of these nodes, which are different tools and services as web pages, we
can kind of understand what you were doing before you got here. So in the upper
corner, you'll see one called supportal. That's our support portal for internal
tools and all of the arrows feeding into that. Were incredibly interesting for
us in terms of what's the likelihood someone goes to blank and then is going to
go open a support ticket or what's the likelihood someone was doing why? And
then they had to go open a support ticket. On the prescriptive side, we are
developing something that we call Insights Hub or Ihub for short. And this was
really in response to a question we would get of how do you accumulate or how do
you accommodate? How do you accumulate all the information at LinkedIn, in
engineering, in this analytic space? And how do you accommodate both the
executive at 10,000 feet who's trying to get an understanding of the health of
the overall ecosystem all the way down to, say, the senior IC, or the software
engineer who wants the nitty gritty details. So one has to be able to go and
look at the overall build time across the entire LinkedIn. And somebody else
needs to be able to go and open the individual, build scan, or Bazel build
report, or whatever it is to understand, oh, this pull request faced this issue,
and that's how we can resolve a problem on a team or in a workflow. This
combines both objective. Those would be scores like the developer build time
with subjective like the CSAT score. So we're trying to kind of blend and
provide this holistic view of both objective and relative measures. We're also
doing that on the left sidebar. If you notice, there's something called the
teams experience. This is scored out of one through five. This is what we call
the experience index. It is not a performance measure in any regard. It doesn't
say here's the performance of the team, but it tries to gauge kind of what's the
overall experience of the team. That is an objective measure. We actually assign
what those scores should be. We tell people, Hey, your builds are slow. Combine
that with a relative measure which is lower on that sidebar, you'll see that we
actually showed the org. We show where the manager is, that we show where a
manager ranks with their peers and we can kind of see, hey, where are you in the
middle of the pack? Or are you kind of at the bottom or the top?
Productivity again is not the same as performance, and we stay away from
employee performance as much as possible. We we really do coach managers and
engineers not to look at these and think if the number is low, you're doing
badly. What's really the case is if the number is low, then you need to
prioritize your developer productivity and we have to do additional work to make
sure that when it comes to promotions and when it comes time to reviews, this
information is not used and we do that. It's important not to make a dashboard
that emphasizes something like lines of code, or number of PRs or number of
deploys for all to see. So we don't do that. That doesn't stop engineers from
doing it right. You can't really stop you can't hide the number of commits that
are happening to your repos. Engineers will do that occasionally, but you don't
want to broadcast to engineering managers in emails. You don't want to put that
emphasis on it. So I'm going to hand it over now. If analytics types, we've just
gone through four of them, descriptive, diagnostic, predictive, and
prescriptive. If analytics types are a progression, what comes next? Shailesh.
Shailesh: Thank you. Thanks alot Grant. Thank you. Yeah. So this type of
analytics have served us very well so far and it will continue to do so. But
what is next? So we think it's augmented analytics. What is augmented analytics?
Basically, we are using AI and ML models to assist us to build out deeper
insights, augment our tools, make them more intelligent, create new intelligent
tools. Let's look at some of the use cases when we have been using this. So the
chart on the left is a normalized distribution of pull request created from a
developer using an IDE, or non IDE, and the x-axis shows the tenure of the
developer at Linkedin. So that all the hypotheses we wanted to test. Does it
mean that a person who had long tenure used less IDE and more command line? But
the chart clearly shows that this hypothesis is disproved when we looked at some
of the statistical models and we figured out that doesn't make that much sense.
We use a lot of frequent pattern matching algorithm like data mining algorithm
like FP growth, to detect change in dimensions like what dimensions frequently
occur together. So this is detecting patterns in the data. This is especially
very useful when you are going to do remote root cause analysis. Like, for
example, the chart here shows the deployment failures. So when you see the
deployment failures, what are the error types that constantly appear, frequently
appear together with other dimensions like location, the type of the data fabric
and all those things. And this is extremely important when there are lots of
lots of dimensions and they keep changing. All of us are running at different
frequency. We use anomaly detection engine like 3rd eye, which LinkedIn open
source few years ago to detect anomalies at scale. So these anomalies are all
happening at our metrics level, at a pipeline and every tool that developer uses
goes through the instrumentation. And if we find any anomaly in that code or in
any pipeline, we'll tag it and take action of it. So these anomaly detection
algorithms take care of seasonality and also the historical trends. We also do a
lot of deep learning algorithms to create embeddings. So one such example on the
chart here looks at, we take all the repos and we try to create an actual
language representation of a repo, to see what are the repos that frequently you
see that build together, how similar dependencies that use the same language,
they are trying to do the same thing. So this helps us in doing causal
experimentation.
One such example is that let's say there are few repos with multiple remote devs
and we can actually gain some kind of impact and calculate the impact. How much
a new repo, which is very similar, will gain by moving to remote development.
Similarly, we build collaborative graphs. For example, we started building a
graph to detect communities of developers who frequently review the code authors
and code reviewers. So we wanted to see the cohorts of people who worked
together. This not only helps us find the cohort of people, but also the people
and also the repos that collaborate on together. So recently we started using
data, coda's data. So far we're only looking at metrics based on instrumentation
of our tools. But now we treat code as a standard dataset, so that we can track
code changes. So here is an example of one such tool we built recently, it's a
semantic natural language code search. So most of the developers were new to
LinkedIn, the struggle, trying to find out how to do certain things.
Documentation is great, but it's very difficult to keep documentation up to
date. And here we have we already have a very successful code search, keyword
based code search. But now how can we use the natural language thing to help new
developers come and adopt to LinkedIn codebase? So here is an example, where we
have a semantically, a statement like How would I want to send a bunch of
messages to Kafka? And you see the model exactly. Tries to find all semantically
relevant code, and surfaces for the user. So this has been, help a lot for the
new engineers also, and also for the tenured engineers. So I have one such the
quotation from one of the testimonials from a recent developer. He said that he
just joined the company two months ago, and this tool has been extremely helpful
for him to find the right snippet. So here what we did was we took an entire
LinkedIn source code and we built a language model out of it. We took every
snippet of a code, we extracted comments, the function name outside of the code,
and we built a model that filled the model, the natural language part and the
code part. And this model is trained to find out exactly a similar code based on
the natural language. Taking it further right. Developers not only use IDE. They
also use a lot of command line tools, and when we know they been used a lot of
command line tools, we have like tens of hundreds of command line tools at
LinkedIn. And it is extremely, very difficult for you to remember the command
especially when we have so much options available. Here is an example of one
such experimentation that we are doing, is like this is a CLI. So in the command
line a developer wants to know how to add a memory to the host. And we just
recorded our internal tool name for this product Coda on how to add memory to
the Host. And the examples here are the real examples, from successful commands
that has been executed earlier in the past, by some other person at LinkedIn. So
how this works is we have as a part of our quantitative data pipeline, we gather
every command line tool that we built at LinkedIn, has the instrumentation
pipeline. So we also track which are the successful commands, which are the
failure commands. We took all of those commands and we try to map to the help
text from the command. So we build a dataset of all the commands that are there
and all the help that is available for this command. And now here you see very
clearly that these are the two examples coming out from the dataset. And there
is no mention anywhere, like the model doesn't know what tool is it. The model
is so generic enough that it can adhere to any new command line tool. So here,
we just ask how to add memory to the host. And the model is trying to find what
is exactly the most relevant thing here and what could the command that could be
more relevant to you.
So here we show the help about what is basically. This command is used by a lot
of our SRE engineers to increase the memory or to decrease the memory for
particular hosts. So this is experimentation, this recently won the LinkedIn
hack day dream big award, so I'll move to the next. Yeah. So we know code is
more important, but also our developers are also spending a lot with knowledge.
It's extremely difficult to find knowledge at one place. We have an internal
tool called Supportal, where we gather all the JIRA tickets, we gather all the
StackOverflow questions, we are also indexing wikis, where we want to see if a
developer experiencing any error or is stuck somewhere, he can come and search
here. So it was earlier using a keyword kind of a search, but we revamped the
search to use a semantic, natural language search. So we indexed everything, all
the wiki pages, the stackoverflow and JIRA tickets. We build kind of a large
language model on the LinkedIn internal dataset. And here the example here is
that a developer comes in and starts searching. He says that I don't know how to
do certain things and what the model is trying to do. The model is trying to
find the JIRA ticket for the stackoverflow question answer. But exactly this is
matching internally with LinkedIn's data. So after we upgraded this new model,
we have seen an uptick in engagement. It is still early to call out the bigger
impact because it just went into production a few weeks ago. Then we started
looking into code intelligence, like, how can we build models to help developers
be more productive? What are the new kind of tools that we can build on it? So
we started collaboration with Microsoft Research called Intelligence Team, and
we look at what are the two here, we are talking about two different models. One
of their core similarity model. So what this model does is trying to find and
exactly similar code you have in your codebase based on the based on the given
function. And it will try to find the most similar function. So how is this
model trained? So we take a function, we obfuscate the function and we'll try to
tell the model that these two functions are the same. And eventually the model
learns that it should not be looking at the variable names. It should be looking
more of a function names. The block of how the code flows, how the data flows
inside the code, and eventually the model done. So we have close to 84% accuracy
on this model to detect a similar code in our codebase. And the next model is
about a code reviewer model. Wouldn't it be great if the A.I. system can just
look at the code reviews in the past and try to recommend reviews on the code
next time? So here we took code diffs and all the code diffs that are happening
at LinkedIn. So we have almost more than ten years of code review data and it's
very high-quality data. So we looked at how we can build a model where we can
recommend reviews based on the earlier past years. So this model is trained
using contrasting learning objective, and it's a generative model. So it looks
at the code diff, it looks at the review that was given. And it can do three
tasks. One task it can do is it can generate a review for you. The second task,
it can even do like code refinement. Like, for example, you have a diff that was
done before the review and the developer accepted the review and the review
changed code diff. Based on that a model it can recommend, ok, this is a review,
but if you do this, this will fix the review as well. And the next thing is the
quality. So it can tell you what the most, if you have a code diff, that is
hundreds and hundreds of lines. It is very difficult for a developer to look at
which part of the code you think most likely get reviewed. So based on that, the
model can tell what are the probability that you should be looking at these many
lines because these lines are reviewed much, much at a higher rate in the past.
So this is open source, this model available from Hugging Face, it has thousands
of downloads so far. Also, it's called unixcoder and code reviewer, and we have
open source the model. And also there is a paper outlining we presented this
paper in the FSC 2022 conference on code review activities, automating code
review activities at large scale pre-training.
Now, sometimes it's extremely difficult for a developer when he's in the IDE. So
if you have seen an example of a model working in a web browser, we also see an
example of a model running inside the command line. Now this is within the IDE,
and sometimes when you're looking in a coding, you'll want to look at the
examples of an API that you are using, or you're looking at some third party
API, how people have used internally. And this is not like it is something
extremely important to know what is the exact code snippet and how can it search
using code to code. And it is difficult to express code in natural language many
times. So here what we are trying to do is you have a code, you highlight the
code and say show internal usages. Here the deep learning model tries to look
into our code similarity model and tries to find what are the similar code that
is there and it will try to bring it in. So this is our next to one of the
experimentation on the code review that we have built an A.I. bot called Casper.
So Casper is using the extractive, so we are in deep learning, there are two
ways right now. One of them is called extract the information retrieval. The
other is called is agenda radio. In the information retrieval, what you do is
that we look at a similar thing and try to surface it. It's like a semantic
search kind of a domain. And in the generative thing you view the model, are
like some certain past piece of the code and tell the model to complete it. So
here we have an extracted way. So we have mine lots of code reviews and we try
to build a model where Casper is our A.I. reviewer. What it looks at the given,
at the pull request, tries to find is it a similar pull request that was done in
the past. What are the reviews from it and surface it to the user. And we have
kind of, we call it A.I. assistant because it doesn't create any pull request on
your behalf, but it will still help you to review the code reviews that
happened. So yeah, we started with this. And where do we think we know in this,
is augment. Thank you so much, and I would like to thank, this was the effort of
a lot of teams, a lot of collaboration at LinkedIn, many different teams
involved in this. And I will definitely thank LinkedIn leadership for giving
this opportunity to present here. And also please tomorrow please attend.
Shivani and Swati talking about remote development at 11:00 right here.
Grant: Thanks for letting us share.